
|
Fig. 4
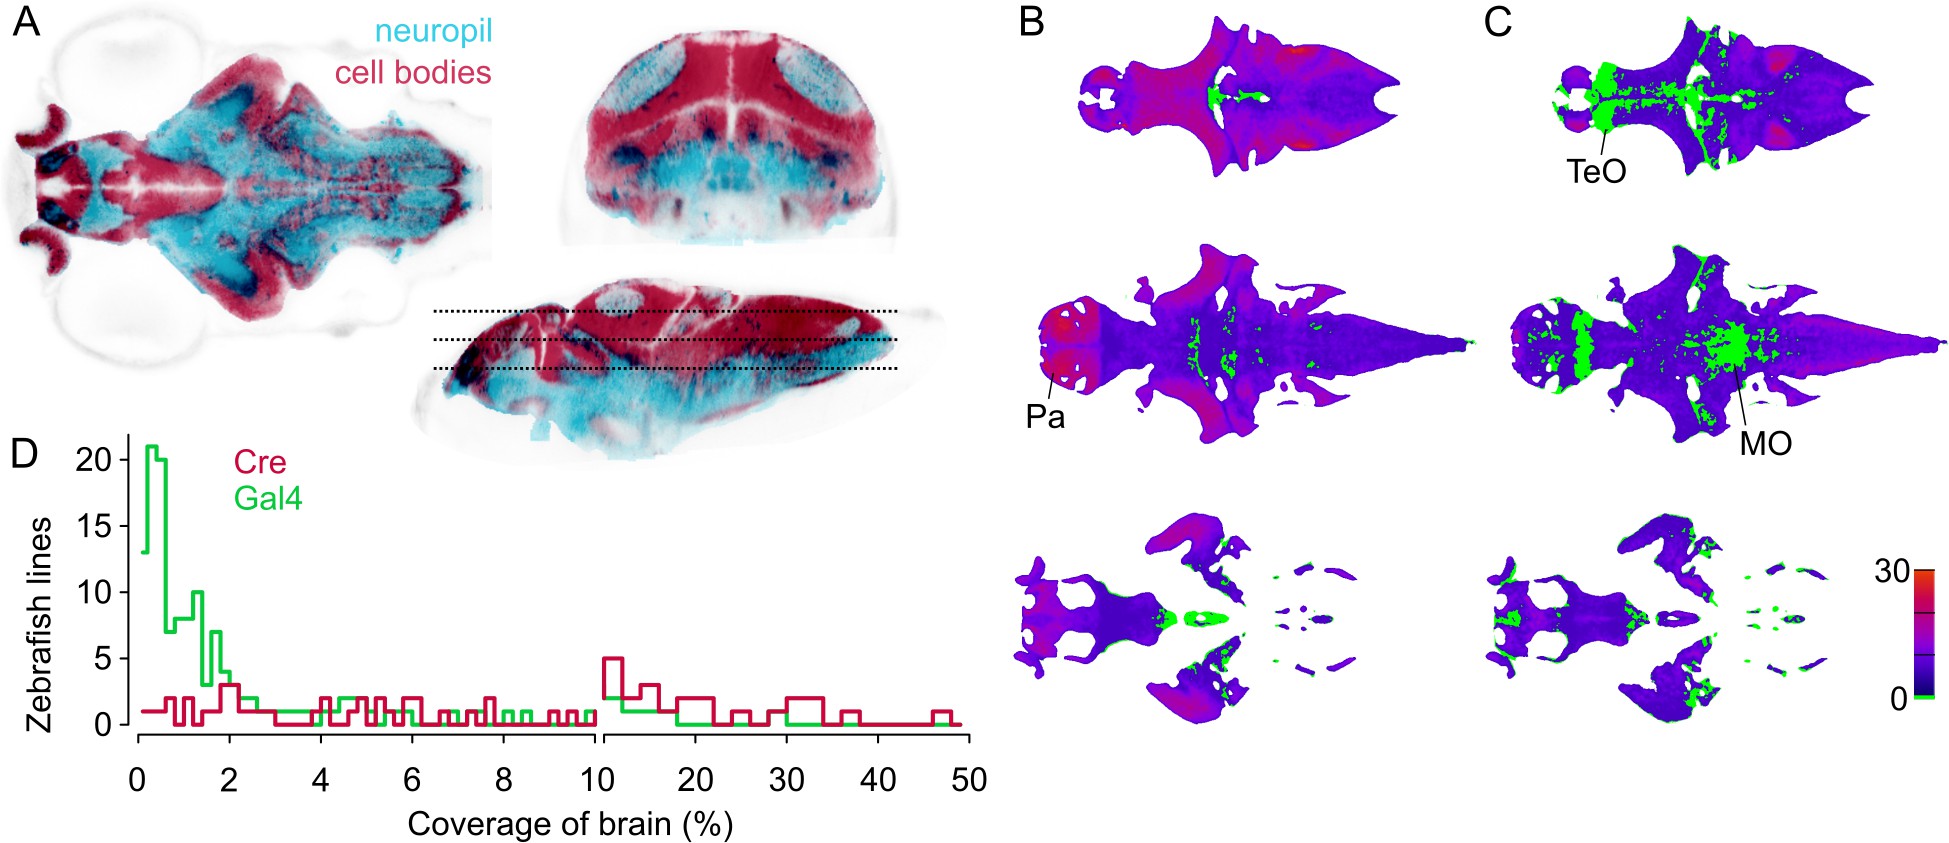
Spatial coverage of Cre and Gal4 enhancer trap lines.
(A) Horizontal (left), coronal (top right), sagittal (bottom right) sections showing huC:nls-mCar (cell bodies, red) and huC:Gal4,UAS:syp-RFP (neuropil, cyan) from ZBB (huC counter-label, gray), illustrating the separation of cell bodies and neuropil in six dpf brains. (B–C) Horizontal sections (at the levels indicated in A) of heat-maps showing the number of et-Cre (B) and et-Gal4 (C) lines that label each voxel within the cellular area of the brain (scale bar, right). Voxels that lack coverage indicated in green. Coverage for Cre lines is highest in the pallium (Pa). Gal4 lines conspicuously lack coverage in the anterior optic tectum (TeO) and in a medial zone of the medulla oblongata (MO). (D) Histogram of the cellular-region coverage for et-Cre (red) and et-Gal4 (green) lines.