
- Title
-
In Toto Imaging of Dynamic Osteoblast Behaviors in Regenerating Skeletal Bone
- Authors
- Cox, B.D., De Simone, A., Tornini, V.A., Singh, S.P., Di Talia, S., Poss, K.D.
- Source
- Full text @ Curr. Biol.
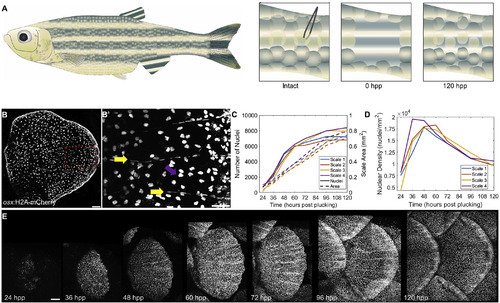
Zebrafish Scale Regeneration (A) Model for scale injury. 16–20 scales are plucked with forceps from the caudal peduncle, as its relatively flat surface allows easier z imaging. By 120 hpp, the scales have replenished osteoblast number and much of the mature scale area. (B) Mature scale of an adult osx:H2A-mCherry fish. Scale bar represents 100 μm. (B’) Zoom of boxed portion of (B) indicating elongated osteoblast nuclei aligned along the mineralized scale radii (yellow arrows) and rounder nuclei on the bottom, incompletely mineralized layer (magenta arrow). Scale bar represents 50 μm. (C) Quantification of osteoblast nuclear number (left axis) and scale area in mm2 (right axis) in four regenerating scales from two fish. (D) Osteoblast nuclear density over time in the four scales quantified in (C). (E) Time course of the first 5 days of scale regeneration in osx:H2A-mCherry fish. Scale bar represents 100 μm. |
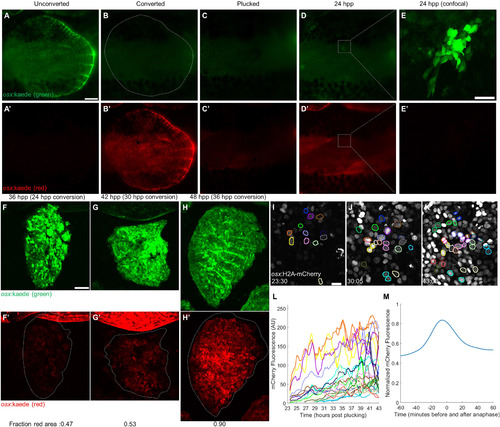
The Initial Scale Osteoblast Pool Regenerates by De Novo Differentiation (A–E) A single scale was cleared of overlapping scales (A and A’), osteoblasts were photoconverted to red (B and B’), and the scale was removed (C and C’). One day later, all osteoblasts present had no detectable photoconverted protein (D–E’). (A)–(D) were acquired with a fluorescence dissecting scope (scale bar represents 250 μm); (E) was acquired with a confocal microscope (scale bar represents 50 μm). (F–H) Scales were allowed to regenerate to 24, 30, and 36 hpp and then photoconverted and imaged again at 36 (F and F’), 42 (G and G’), and 48 hpp (H and H’), respectively. The average fraction of red-expressing area for each time point is indicated in the bottom left corner of each image (n = 6 scales per time point). Scale bar represents 100 μm. (I–K) Representative pictures from a video of scale regeneration in osx:H2A-mCherry fish, acquired from 23 to 43 hpp. Colored nuclear outlines indicate tracked nuclei. Outlines present in (J) and (K), but not in (I), represent nuclei first detected later in the video; outlines of the same color indicate daughter nuclei of a dividing nucleus. Scale bar represents 10 μm. (L) Fluorescence levels of tracked nuclei. Line colors correspond to outlines in (I)–(K). Splitting of one line into two denotes mitosis. (M) Average fluorescence level of 91 tracked nuclei relative to their peak from 60 min before to 60 min after anaphase. By 60 min post-anaphase, nuclear fluorescence decreased 36.1% from its peak but increased 12.5% from the start of tracking. |
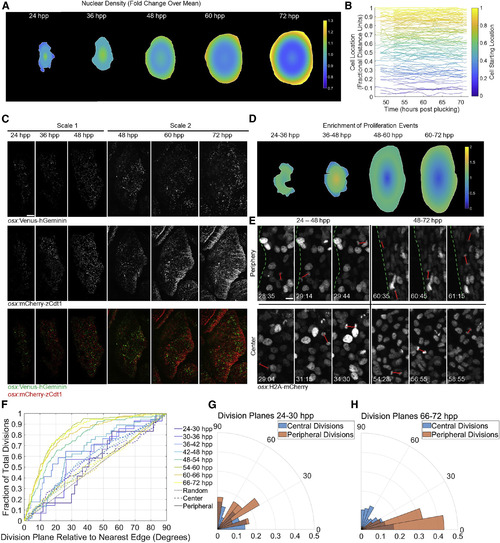
Osteoblast Proliferation Dynamics Acquire Peripheral Bias during Scale Regeneration (A) Heatmap showing nuclear density across regenerating scales over time. n = 6 scales per time point. Color bar indicates relative change in nuclear density over entire scale at that time point. (B) Relative radial distance of 113 individually tracked nuclei in videos of a 48- to 72-hpp regenerating scale. Each line represents an individual nucleus, color-coded based on starting point. (C) osx:Venus-hGeminin; osx:mCherry-zCdt1 fish imaged from 24 to 48 (left three columns) and 48 to 72 (right three columns) hpp. (Top row) osx:Venus-hGeminin (S/G2/M cells) is shown. (Middle row) osx:mCherry-zCdt1 (G1/G0 cells) is shown. (Bottom row) Overlay is shown. Distribution of cell division shifts outward to the scale periphery over time. Scale bar represents 100 μm. (D) Heatmap showing changes in proliferation relative to osteoblast density in scales over time. The distribution of osteoblast divisions from 24 to 72 hpp was divided by the density distribution calculated in (A). (E) Images from two osx:H2A-mCherry videos indicating orientation planes of divisions (red lines) near the edge (top row) and in the center (bottom row) of the scale from 24 to 48 hpp (left column) and 48 to 72 hpp (right column) are shown. Dotted green lines indicate scale edge. Scale bar represents 10 μm. (F) Cumulative distribution function of division orientations (degrees) shown in (E). Divisions binned in 6-hr windows are shown. Solid lines indicate divisions in the outer 10% of the scale area; dashed lines indicate divisions in the inner 90%. Gray dotted line indicates randomly oriented divisions. Fraction of divisions on the y axis is cumulative, i.e., at x = 10 degrees, the y value indicates the number of divisions in that time bin within 0–10 degrees of parallel to the edge, divided by all divisions in the bin; at x = 20, y value indicates all divisions within 0–20 degrees of parallel, etc., until the fraction reaches 1.0. (G and H) Probability polar histograms indicating division plane relative to plane of scale edge for the first (G) and last (H) time bins from (F). |
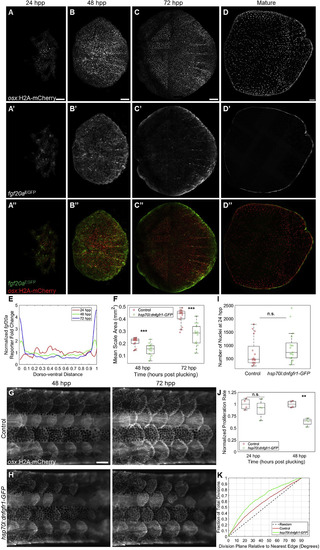
Fibroblast Growth Factor Signaling Modulates Scale Regeneration (A–C’’) osx:H2A-mCherry; fgf20aEGFP regenerating scales at 24 (A and A’’), 48 (B and B’’), and 72 (C and C’’) hpp. fgf20a enhancer trap fluorescence (middle row) is initially distributed evenly but later localizes to the scale periphery. Scale bars represent 100 μm. (D and D’’) Mature adult osx:H2A-mCherry; fgf20aEGFP zebrafish scale with fluorescence restricted to the scale periphery. Scale bar represents 100 μm. Multiple images were stiched together in (C)–(D’’). (E) Quantification of fold change relative to mean EGFP expression in regenerating scales from 24 to 72 hpp. (F) Box and whisker plot of average scale area for wild-type (red circles) and hsp70l:dnfgfr1-GFP (green circles) fish at 48 and 72 hpp. hsp70l:dnfgfr1-GFP fish had smaller scales at both time points (n = 15 control, 14 hsp70l:dnfgfr1-GFP fish). ∗∗∗p < 0.001. (G and H) Regenerating scales at 48 (left column) and 72 (right column) hpp in heat-shocked osx:H2A-mCherry; hsp70l:dnfgfr1-GFP fish (H) and osx:H2A-mCherry siblings lacking the heat shock transgene (G). Scale bar represents 500 μm. (I) Box and whisker plot comparing number of nuclei counted in individual control and hsp70l:dnfgfr1-GFP fish at 24 hpp. No significant difference was detected (n = 17 control scales, 17 hsp70l:dnfgfr1-GFP scales). (J) Box and whisker plot showing proliferation rate of control and hsp70l:dnfgfr1-GFP scales imaged in the 24 hpp+ range and 48 hpp+ range, normalized to the mean proliferation rate of time-matched controls. Proliferation is significantly reduced in hsp70l:dnfgfr1-GFP fish at 48 hpp+ (n = 4 control and 4 hsp70l:dnfgfr1-GFP scales, 2 each imaged from 48 to 58 hpp and 53 to 63 hpp) but at 24 hpp+ (n = 4 control and 4 hsp70l:dnfgfr1-GFP fish, 2 each imaged from 24 to 34 hpp and 27 to 37 hpp). ∗∗p < 0.01. (K) Cumulative distribution function of division plane relative to nearest scale edge for control and hsp70l:dnfgfr1-GFP scales imaged from 48 hpp onward. hsp70l:dnfgfr1-GFP fish show a greater bias toward dividing in line with the plane of the nearest edge. |
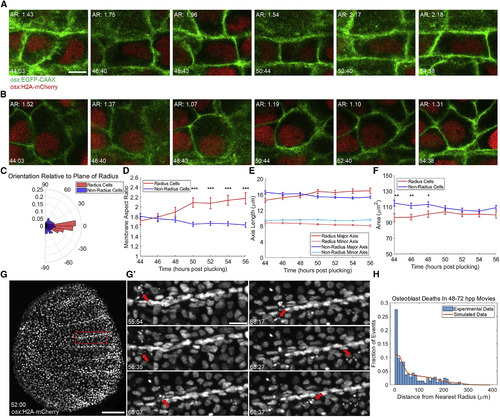
Scale Radii Regenerate by Patterned Osteoblast Shape Changes and Cell Death Events (A and B) Individual tracked radius- (A) and non-radius-forming (B) osteoblasts during a 10-hr video, shown at approximately 2-hr intervals. (Top left of each) Membrane aspect ratio is shown. (Bottom left) Time post-plucking (hours:minutes) is shown. Scale bar represents 5 μm. (C) Polar histogram indicating orientation of the major axis of tracked osteoblasts to the plane of radius growth (n = 132 non-radial osteoblasts, 67 radial osteoblasts, imaged 10–12 hr). (D) Average membrane aspect ratio for radius- (red line) and non-radius-forming cells (blue line) over time. By 50 hpp, the aspect ratio of radius osteoblasts is significantly greater than non-radius osteoblasts. ∗∗∗p < 0.001. (E) Data from (D) decomposed into changes in length of major (darker shading) and minor (lighter shading) axes of radius (red) and non-radius cells (blue). (F) Changes in mean areas of radius and non-radius osteoblasts. Increases in radius cell area and decreases in non-radius cell area are not individually significant but result in loss of a significant difference between areas of radius and non-radius cells. ∗p <0.005; ∗∗p < 0.01. (G) A regenerating scale expressing osx:H2A-mCherry at 52 hpp, the first time point of a 20-hr video. Scale bar represents 100 μm. Error bars indicate ± SEM. (G’) Nuclear fragmentation (red arrows) at various times from the region outlined in (G) is depicted. Scale bar represents 20 μm. (H) Histogram of cell death data from three >20-hr videos spanning 48–72 hpp total. 273 hand-counted cell deaths were plotted by distance from the nearest radius (blue bars, bins of 10 μm). Observed data were compared to the results of 1,000 simulations of randomly placed cell deaths (273,000 random cell deaths, orange line). |