
Fig. 3
- ID
- ZDB-FIG-190426-18
- Publication
- Cox et al., 2018 - In Toto Imaging of Dynamic Osteoblast Behaviors in Regenerating Skeletal Bone
- Other Figures
- All Figure Page
- Back to All Figure Page
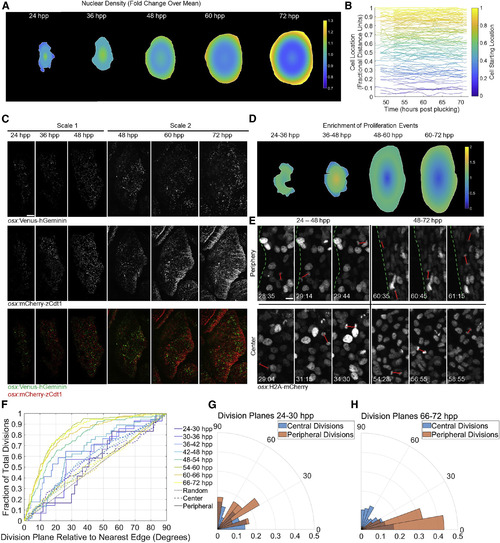
Osteoblast Proliferation Dynamics Acquire Peripheral Bias during Scale Regeneration (A) Heatmap showing nuclear density across regenerating scales over time. n = 6 scales per time point. Color bar indicates relative change in nuclear density over entire scale at that time point. (B) Relative radial distance of 113 individually tracked nuclei in videos of a 48- to 72-hpp regenerating scale. Each line represents an individual nucleus, color-coded based on starting point. (C) osx:Venus-hGeminin; osx:mCherry-zCdt1 fish imaged from 24 to 48 (left three columns) and 48 to 72 (right three columns) hpp. (Top row) osx:Venus-hGeminin (S/G2/M cells) is shown. (Middle row) osx:mCherry-zCdt1 (G1/G0 cells) is shown. (Bottom row) Overlay is shown. Distribution of cell division shifts outward to the scale periphery over time. Scale bar represents 100 μm. (D) Heatmap showing changes in proliferation relative to osteoblast density in scales over time. The distribution of osteoblast divisions from 24 to 72 hpp was divided by the density distribution calculated in (A). (E) Images from two osx:H2A-mCherry videos indicating orientation planes of divisions (red lines) near the edge (top row) and in the center (bottom row) of the scale from 24 to 48 hpp (left column) and 48 to 72 hpp (right column) are shown. Dotted green lines indicate scale edge. Scale bar represents 10 μm. (F) Cumulative distribution function of division orientations (degrees) shown in (E). Divisions binned in 6-hr windows are shown. Solid lines indicate divisions in the outer 10% of the scale area; dashed lines indicate divisions in the inner 90%. Gray dotted line indicates randomly oriented divisions. Fraction of divisions on the y axis is cumulative, i.e., at x = 10 degrees, the y value indicates the number of divisions in that time bin within 0–10 degrees of parallel to the edge, divided by all divisions in the bin; at x = 20, y value indicates all divisions within 0–20 degrees of parallel, etc., until the fraction reaches 1.0. (G and H) Probability polar histograms indicating division plane relative to plane of scale edge for the first (G) and last (H) time bins from (F). |