
Fig. 1
- ID
- ZDB-FIG-190426-16
- Publication
- Cox et al., 2018 - In Toto Imaging of Dynamic Osteoblast Behaviors in Regenerating Skeletal Bone
- Other Figures
- All Figure Page
- Back to All Figure Page
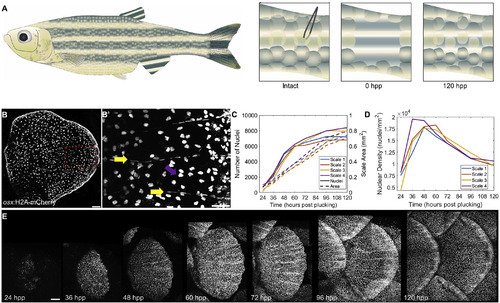
Zebrafish Scale Regeneration (A) Model for scale injury. 16–20 scales are plucked with forceps from the caudal peduncle, as its relatively flat surface allows easier z imaging. By 120 hpp, the scales have replenished osteoblast number and much of the mature scale area. (B) Mature scale of an adult osx:H2A-mCherry fish. Scale bar represents 100 μm. (B’) Zoom of boxed portion of (B) indicating elongated osteoblast nuclei aligned along the mineralized scale radii (yellow arrows) and rounder nuclei on the bottom, incompletely mineralized layer (magenta arrow). Scale bar represents 50 μm. (C) Quantification of osteoblast nuclear number (left axis) and scale area in mm2 (right axis) in four regenerating scales from two fish. (D) Osteoblast nuclear density over time in the four scales quantified in (C). (E) Time course of the first 5 days of scale regeneration in osx:H2A-mCherry fish. Scale bar represents 100 μm. |