- Title
-
Genetic targeting and anatomical registration of neuronal populations in the zebrafish brain with a new set of BAC transgenic tools
- Authors
- Förster, D., Arnold-Ammer, I., Laurell, E., Barker, A.J., Fernandes, A.M., Finger-Baier, K., Filosa, A., Helmbrecht, T.O., Kölsch, Y., Kühn, E., Robles, E., Slanchev, K., Thiele, T.R., Baier, H., Kubo, F.
- Source
- Full text @ Sci. Rep.
|
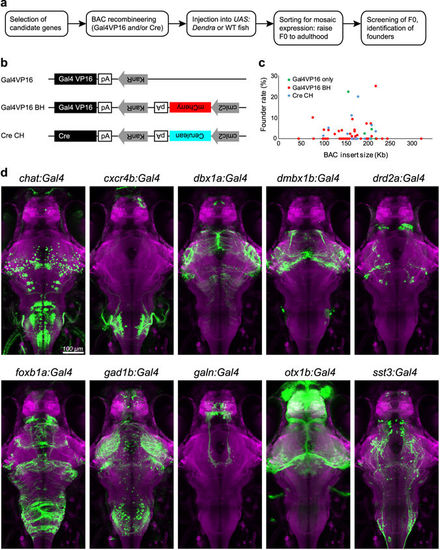
A candidate-based BAC screen identifies new genetic tools for targeting neuronal subpopulations. (a) Workflow to establish BAC transgenic fish lines. WT, wild-type. (b) Plasmid constructs used for BAC recombineering. KanR, kanamycine-resistant gene; pA, polyadenylation signal. (c) Relationship between the genomic insert length of all BAC constructs (7 Gal4VP16 BACs, 39 Gal4VP16-Bleeding Heart BACs, and 12 Cre-Cold Heart BACs) and their founder rate (percentage of germline founders out of total adult fish screened). Note that the founder rate is not correlated with the genomic insert length (R-squared = 0.0007). (d) Dorsal view of 6 dpf old larval brains showing the live expression pattern of ten selected transgenic Gal4 lines (green; Dendra-kras, GCaMP6s or EGFP). Brains have been registered via co-expression of HuC:lynTagRFP-T (magenta). Scale bar, 100 µm. |
|
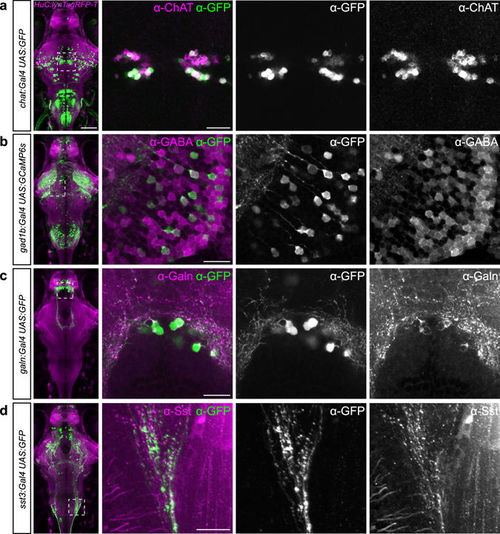
New transgenic lines largely recapitulate endogenous gene expression. (a–d) Antibody stainings of 6 dpf old larvae against GFP (green) and ChAT (a), GABA (b), Galanin (c) or Somatostatin (d), respectively (magenta). Genotypes are indicated on the left. Whole-brain images on the left show live expression pattern (lynTagRFP-T in magenta), outlining the location of the magnified regions on the right. Scale bar, 100 µm for overview, 20 µm for magnified images. |
|
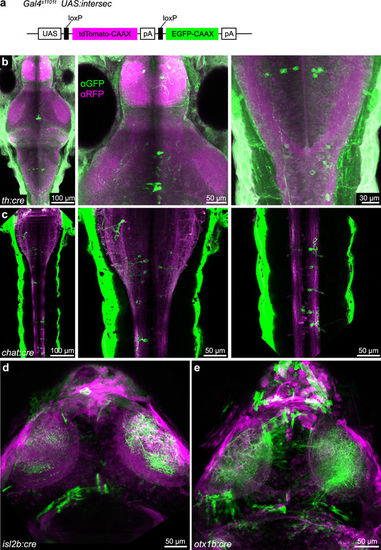
Cre-expressing BAC constructs allow intersectional genetics. (a) UAS:intersec construct for intersectional genetic approach. A pan-neuronal Gal4 line (Gal4s1101t) was used in this figure. (b) Antibody staining against GFP and RFP reveals highly variegated, transgenic expression of th:cre stable transgenic line. (c–e) Live imaging showing transient expression of chat:cre (c), isl2b:cre (d) and otx1b:cre (e). |
|
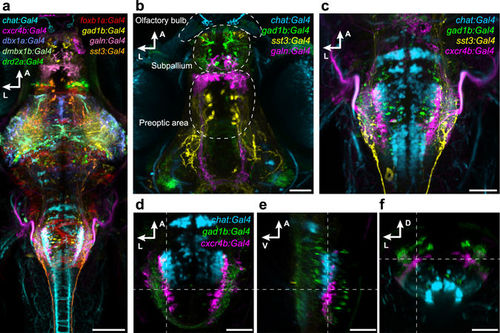
Registration of transgenic lines illustrates expression in distinct neuronal subpopulations. (a) Dorsal view on a reference brain showing the expression of selected, co-registered Gal4 lines. (b,c) Z-projection of confocal stacks showing the expression pattern of chat:Gal4, gad1b:Gal4, sst3:Gal4 and galn:Gal4 or cxcr4b:Gal4, respectively, in the deep fore-/midbrain (b), and in the hindbrain (c). (d–f) Single confocal slices of chat:Gal4, gad1b:Gal4, and cxcr4b:Gal4 expression in the hindbrain, in dorsal (d), lateral (e) and cross-sectional view (f). Dashed lines indicate plane positions. Scale bar, 100 µm in (a) and 50 µm in (b–f). |
|
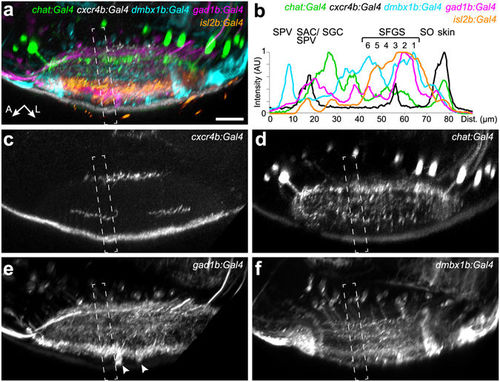
New transgenic lines label distinct sublaminae in the tectal neuropil. Lateral view of the tectal neuropil shows registered expression pattern of chat:Gal4, cxcr4b:Gal4, dmbx1b:Gal4, gad1b:Gal4, and isl2b:Gal4, as merged (a) or single channels (c–f). (b) Fluorescence intensity plots along the boxed regions in (a–f). Intensity peaks of isl2b:Gal4 expression were used for layer determination. SIN cell bodies labeled by gad1b:Gal4 are marked by arrowheads in (e). The peak for dmbx1b:Gal4 in the SPV layer reflects labeled periventricular cell bodies. |
|
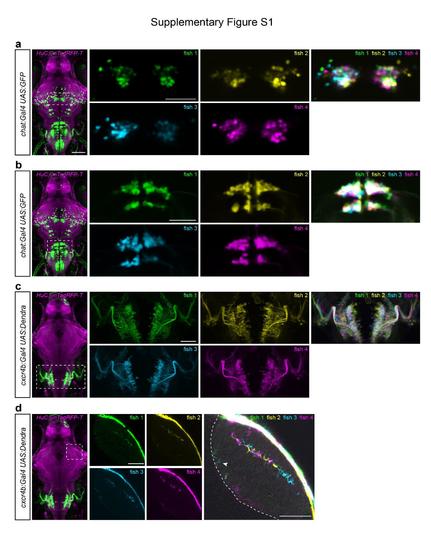
Registration of different larvae of the same transgenic line illustrates variegated, but highly reproducible expression patterns. (a,b) Single confocal slices of chat:Gal4 expression in extraocular motor nuclei (a) and hindbrain neurons (b). After sorting larvae for bright expression of the UAS reporter gene, four different larvae were imaged and co-registered using HuC:lyn-TagRFPT expression as a reference. (c) Z-projection of confocal stacks showing the expression pattern of cxcr4b:Gal4 in the hindbrain. The overlay image reveals that consistent cell body position and axonal projections are largely consistent across four individual fish. (d) Single confocal slices of cxcr4b:Gal4 expression in the tectum. An overexposed overlay is shown on the right. The labeled axons innervate the same layers (SFGS3 and SAC/SPV, arrow head) in the tectal neuropil in all four fish, although their precise location within the layers is variable between the four fish. Dashed line in the right panel indicates the border between the tectal neuropil and cell body layer. Scale bar, 100 μm (whole-brain images on the left) and 50 μm (close-ups). |

