
FIGURE
Fig. 2
- ID
- ZDB-FIG-170815-44
- Publication
- Förster et al., 2017 - Genetic targeting and anatomical registration of neuronal populations in the zebrafish brain with a new set of BAC transgenic tools
- Other Figures
- All Figure Page
- Back to All Figure Page
Fig. 2
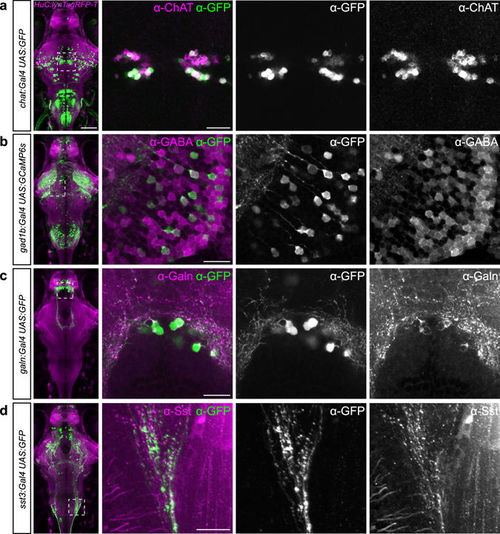
New transgenic lines largely recapitulate endogenous gene expression. (a–d) Antibody stainings of 6 dpf old larvae against GFP (green) and ChAT (a), GABA (b), Galanin (c) or Somatostatin (d), respectively (magenta). Genotypes are indicated on the left. Whole-brain images on the left show live expression pattern (lynTagRFP-T in magenta), outlining the location of the magnified regions on the right. Scale bar, 100 µm for overview, 20 µm for magnified images. |
Expression Data
Expression Detail
Antibody Labeling
Phenotype Data
Phenotype Detail
Acknowledgments
This image is the copyrighted work of the attributed author or publisher, and
ZFIN has permission only to display this image to its users.
Additional permissions should be obtained from the applicable author or publisher of the image.
Full text @ Sci. Rep.