
- Title
-
3D Finite Element Electrical Model of Larval Zebrafish ECG Signals
- Authors
- Crowcombe, J., Dhillon, S.S., Hurst, R.M., Egginton, S., Müller, F., Sík, A., Tarte, E.
- Source
- Full text @ PLoS One
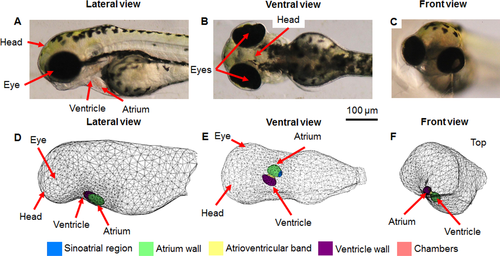
Comparison of 3D model geometry to 3 dpf zebrafish anatomy. A) lateral, B) ventral, C) front brightfield views; D) lateral, E) ventral F) front view of model. Different coloured regions highlight the distinct heart regions within the model. |
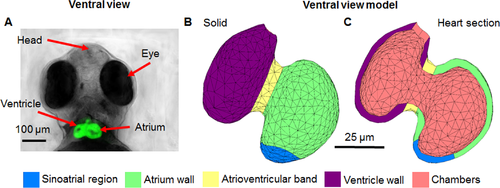
Image of 3 dpf zebrafish heart compared to model heart geometry. All images are from a ventral view. A) depiction of a 3 dpf Tg(fli-1:EGFP) zebrafish with a fluorescing heart, B) solid view of heart geometry, C) model heart geometry cut through showing the distinct regions. |
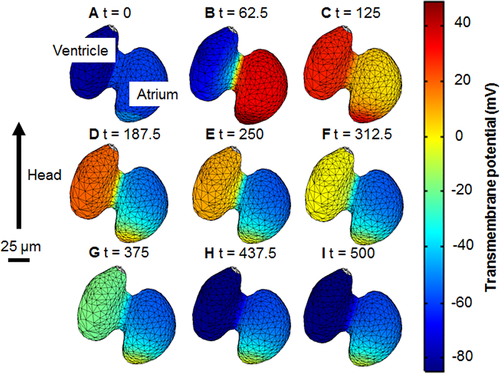
Temporal sequence of transmembrane potential (Vm). The propagation of an action potential through the heart is shown at different times. Nine time steps were chosen to show the progression of the action potentials through all stages of the cardiac cycle. A) the heart at rest B) atrial depolarisation C) ventricular depolarisation D) the end of atrial repolarisation and ventricular plateau stage E,F,G,H) ventricular repolarisation I) returning to the rest state. The wave originates at the sinoatrial region then it progresses across the atrium, through the atrioventricular band and into the ventricle. An animation is given in S2 File. |
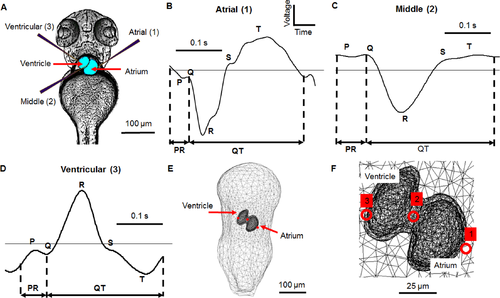
Electrode positions used for electrocardiogram recording with the corresponding measurements and model positions in a 3 dpf zebrafish. A) Processed image in ventral view showing electrodes in different recording positions. Electrode 1 is positioned over the atrium, electrode 2 over the atrioventricular band and electrode 3 over the ventricle, B) A representative atrial recording showing the key ECG features: P wave, QRS complex, T wave, PR interval and QT interval, C) A representative middle recording, D) A representative ventricular recording, E) Expanded ventral view of equivalent electrode positions within the model, F) Close-up ventral view of electrode positions over the heart. The signals from positions 1 and 3 were measured at the same time on the same zebrafish, that from position 2 was measured on a different animal and hence no voltage scale is shown. A positive deflection in the ECG is caused by the depolarisation wave moving towards the recording electrode |