
FIGURE
Fig. 1
- ID
- ZDB-FIG-171128-1
- Publication
- Crowcombe et al., 2016 - 3D Finite Element Electrical Model of Larval Zebrafish ECG Signals
- Other Figures
- All Figure Page
- Back to All Figure Page
Fig. 1
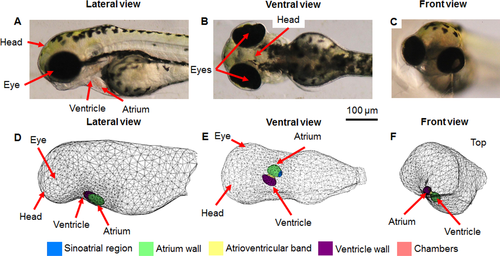
Comparison of 3D model geometry to 3 dpf zebrafish anatomy. A) lateral, B) ventral, C) front brightfield views; D) lateral, E) ventral F) front view of model. Different coloured regions highlight the distinct heart regions within the model. |
Expression Data
Expression Detail
Antibody Labeling
Phenotype Data
Phenotype Detail
Acknowledgments
This image is the copyrighted work of the attributed author or publisher, and
ZFIN has permission only to display this image to its users.
Additional permissions should be obtained from the applicable author or publisher of the image.
Full text @ PLoS One