
Fig. 4
- ID
- ZDB-FIG-171128-4
- Publication
- Crowcombe et al., 2016 - 3D Finite Element Electrical Model of Larval Zebrafish ECG Signals
- Other Figures
- All Figure Page
- Back to All Figure Page
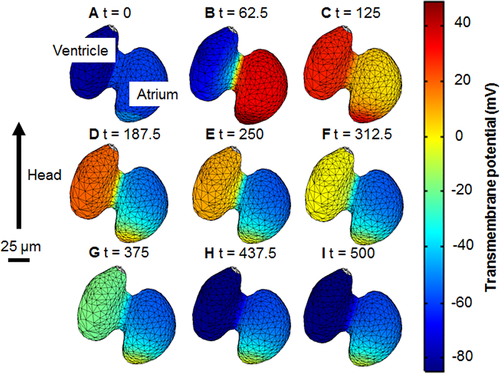
Temporal sequence of transmembrane potential (Vm). The propagation of an action potential through the heart is shown at different times. Nine time steps were chosen to show the progression of the action potentials through all stages of the cardiac cycle. A) the heart at rest B) atrial depolarisation C) ventricular depolarisation D) the end of atrial repolarisation and ventricular plateau stage E,F,G,H) ventricular repolarisation I) returning to the rest state. The wave originates at the sinoatrial region then it progresses across the atrium, through the atrioventricular band and into the ventricle. An animation is given in S2 File. |