
- Title
-
Phenotypic Plasticity Regulates Candida albicans Interactions and Virulence in the Vertebrate Host
- Authors
- Mallick, E.M., Bergeron, A.C., Jones, S.K., Newman, Z.R., Brothers, K.M., Creton, R., Wheeler, R.T., Bennett, R.J.
- Source
- Full text @ Front Microbiol
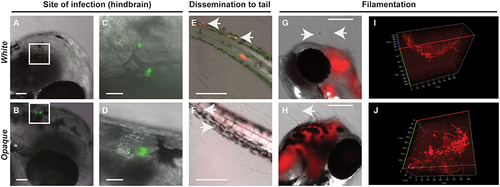
Both white and opaque phenotypic states of C. albicans infect, disseminate, and are induced to undergo filamentation in vivo. (A) Hindbrain of wild type zebrafish in the infected with 8 C. albicans white cells (CAY4975) pre-stained with AlexaFluor-488 (see Methods) at 30 min post-injection. Magnification, 10 ×; scale bar, 50 µm. White box indicates C. albicans cells in the hindbrain and this area is shown at higher magnification in (C). (B) Hindbrain of wild type zebrafish infected with 12 C. albicans opaque cells (CAY4986) pre-stained with AlexaFluor-488 (see Methods) at 30 min post-infection. Magnification, 10 ×; scale bar, 50 µm. White box indicates C. albicans cells present in the hindbrain shown at higher magnification in (D). (C) Higher magnification of white box in (A). Magnification, 40 ×; scale bar, 20 µm. (D) Higher magnification of white box in (B). Magnification, 40 ×; scale bar, 20 µm. (E) Wild type zebrafish were infected with >200 C. albicans white cells expressing a dTomato reporter (CAY4975) and kept at 25°C. Shown are C. albicans cells that have disseminated to the tail (see arrows) at 2 days post-infection. Magnification, 10 ×. Scale bar, 200 µm. (F) Wild type zebrafish were infected with 50 opaque C. albicans cells expressing dTomato (CAY4986) and kept at 25°C. Shown are C. albicans cells that have disseminated to the tail (see arrows) at 1 day post-infection. Magnification, 10 ×; scale bar, 200 µm. (G) 10 × image of wild type zebrafish infected with 25 C. albicans white cells expressing a dTomato reporter (CAY4975) at 9 days post-infection. Arrows indicate fungal filaments penetrating out of the fish′s head. Scale bar, 200 µm. (H) 10 × image of wild type zebrafish infected with 100 C. albicans opaque cells expressing a dTomato reporter (CAY4986) and stained with AlexaFluor-488 at 5 days post-infection. Arrow indicates filamentation out of the fish′s head. Scale bar, 200 µm. (I) Confocal microscopy of zebrafish infected with C. albicans white cells (CAY4975) expressing a dTomato reporter at 1 day post-infection and exhibiting filamentation. Magnification, 20 ×. (J) Confocal microscopy of zebrafish infected with C. albicans opaque cells expressing a dTomato reporter (CAY4986) at 1 day post-infection and exhibiting filamentation. Magnification, 20 ×. |
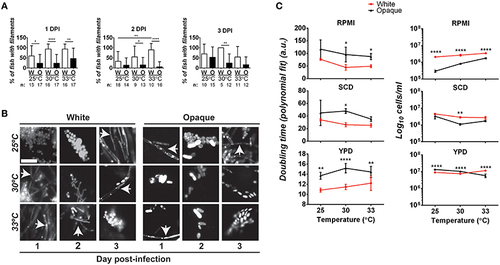
Comparative analysis of filamentation and growth rates in white and opaque C. albicans cells. (A) Zebrafish larvae were infected with 21–50 AlexaFluor-568 stained C. albicans white (W) or opaque (O) cells expressing dTomato and housed at the indicated temperature after infection. At 1, 2, and 3 days post-infection (DPI) live fish were crushed (see Methods) and assessed for the presence of filaments microscopically. “n” indicates the number of fish examined for each experiment. Shown are the mean percentages of fish containing filamentous C. albicans cells ± SD. *p < 0.05; **p < 0.01; ****p < 0.0001. Data are a compilation of five independent experiments. (B) Representative microscopic images of the fish assessed in (A). Arrows indicate filaments/hyphae. Magnification, 40 ×; scale bar, 20 µm. (C) C. albicans white (CAY4975) and opaque (CAY4986) cells were grown in 96-well plates in YPD, SCD, or RPMI media at 25, 30, or 33°C. Cell growth was analyzed using a Biotek Synergy HT plate reader for 24 h. OD600 was measured at 15 min intervals. Data were analyzed using a previously described Matlab script. Shown are the average Log10 cells/ml at saturation ± SD for white and opaque cells at the designated temperature. Data is representative of 3-4 biological replicates each done in triplicate. Statistically significant differences were determined by two-way ANOVA and Sidak′s Multiple Comparisons test. *p < 0.05; **p < 0.01; ***p < 0.001; ****p < 0.0001. |
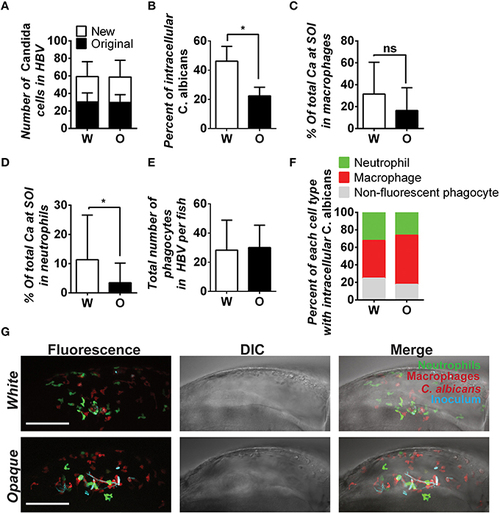
C. albicans white cells are phagocytosed more efficiently than opaque cells in vivo. AlexaFluor-647 stained white or opaque cells expressing dTomato (CAY4975 and CAY4986, respectively) were microinjected into the hindbrain ventricle of transgenic fish that contain EGFP-expressing neutrophils and mCherry-expressing macrophages. Larvae were screened post-injection to identify those with 20–50 C. albicans cells at the site of injection and subsequently imaged 4 h post-injection via confocal microscopy. (A) The number of C. albicans cells present in the hindbrain ventricle (HBV) after microinjection (AlexaFluor 647-labeled cells) and the number of C. albicans cells present 4 h post-injection (cells displaying cytosolic dTomato fluorescence) ± SD. (B) The percentage of C. albicans cells inside vs. outside phagocytes at the site of infection was calculated for each fish (see Methods). Shown are the average percentages of intracellular cells ± SEM. Statistically significant differences were determined using a Student′s T-test. *p < 0.05. (C) Mean percentages of C. albicans cells present in zebrafish macrophages at the site of infection (SOI) ± SD. Statistically significant differences determined using a Student′s T-test. ns, not significant. (D) Mean percentages of C. albicans cells present in neutrophils at the site of infection ± SD. Statistically significant differences determined using a Student′s T-test. *p < 0.05. (E) Total number of phagocytes (neutrophils, macrophages, and non-fluorescent phagocytes) recruited to the site of infection for each fish. Shown are mean numbers of phagocytes in the HBV per fish ± SD. (F) Breakdown of phagocyte subtypes with intracellular C. albicans cells at the site of infection. (G) Confocal images of representative fish in white and opaque cell cohorts. Maximum projections made from Z-stacks with 39 slices and 23 slices for white and opaque cells, respectively. Scale bar, 100 µm. Data were collected over 9 independent experiments with 14 and 22 individual fish in the white and opaque cohorts, respectively. |