
|
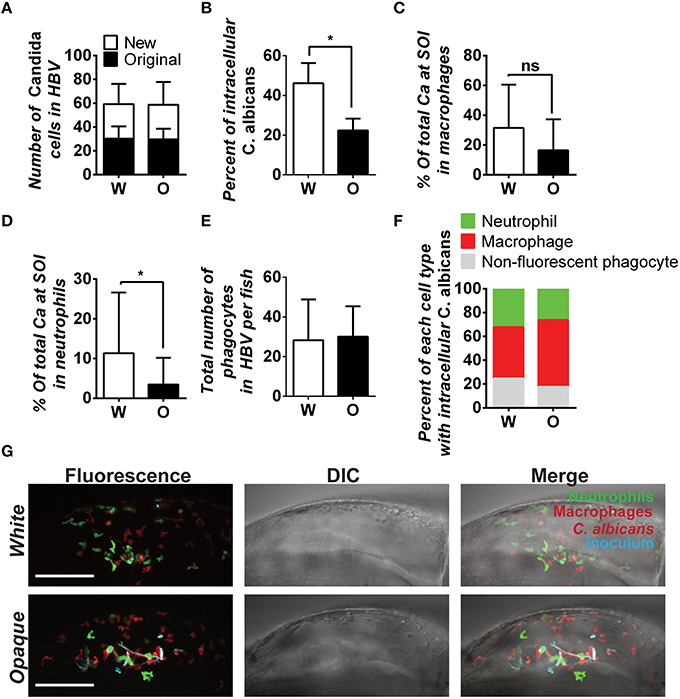
Fig. 8
C. albicans white cells are phagocytosed more efficiently than opaque cells in vivo. AlexaFluor-647 stained white or opaque cells expressing dTomato (CAY4975 and CAY4986, respectively) were microinjected into the hindbrain ventricle of transgenic fish that contain EGFP-expressing neutrophils and mCherry-expressing macrophages. Larvae were screened post-injection to identify those with 20–50 C. albicans cells at the site of injection and subsequently imaged 4 h post-injection via confocal microscopy. (A) The number of C. albicans cells present in the hindbrain ventricle (HBV) after microinjection (AlexaFluor 647-labeled cells) and the number of C. albicans cells present 4 h post-injection (cells displaying cytosolic dTomato fluorescence) ± SD. (B) The percentage of C. albicans cells inside vs. outside phagocytes at the site of infection was calculated for each fish (see Methods). Shown are the average percentages of intracellular cells ± SEM. Statistically significant differences were determined using a Student′s T-test. *p < 0.05. (C) Mean percentages of C. albicans cells present in zebrafish macrophages at the site of infection (SOI) ± SD. Statistically significant differences determined using a Student′s T-test. ns, not significant. (D) Mean percentages of C. albicans cells present in neutrophils at the site of infection ± SD. Statistically significant differences determined using a Student′s T-test. *p < 0.05. (E) Total number of phagocytes (neutrophils, macrophages, and non-fluorescent phagocytes) recruited to the site of infection for each fish. Shown are mean numbers of phagocytes in the HBV per fish ± SD. (F) Breakdown of phagocyte subtypes with intracellular C. albicans cells at the site of infection. (G) Confocal images of representative fish in white and opaque cell cohorts. Maximum projections made from Z-stacks with 39 slices and 23 slices for white and opaque cells, respectively. Scale bar, 100 µm. Data were collected over 9 independent experiments with 14 and 22 individual fish in the white and opaque cohorts, respectively.