
- Title
-
Eppur Si Muove: Evidence for an External Granular Layer and Possibly Transit Amplification in the Teleostean Cerebellum
- Authors
- Biechl, D., Dorigo, A., Köster, R.W., Grothe, B., Wullimann, M.F.
- Source
- Full text @ Front. Neuroanat.
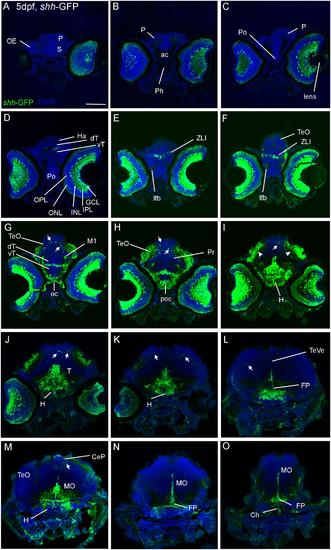
Confocal photomicrographs (maximum projections) of transverse sections of a shh-GFP zebrafish larva at 5 dpf immunostained for GFP (with DAPI as counterstain) show levels from telencephalon to medulla oblongata (A-O). Note in particular basal expression in floor plate (J-O), hypothalamus (I-M), and dorsal (alar plate) tectal (G-I) and cerebellar (J-M) GFP-expressing cells (arrows). Arrowheads indicate primary visual projections in optic tectum. See text for more details. Scale bar in (A): 100 µm (applies to all panels). CeP, cerebellar plate; dT, dorsal thalamus; FP, floor plate; GCL, ganglion cell layer; H, hypothalamus; Ha, habenula; INL, inner nuclear layer; IPL, inner plexiform layer; MO, medulla oblongata; oc, optic chiasma; OC, otic capsule; ONL, outer nuclear layer; P, pallium; poc, postoptic commissure; PTd, dorsal part of posterior tuberculum; S, subpallium; T, midbrain tegmentum; TeO, optic tectum; TeVe, tectal ventricle; vT, ventral thalamus (prethalamus); ZLI, zona limitans intrathalamica. |
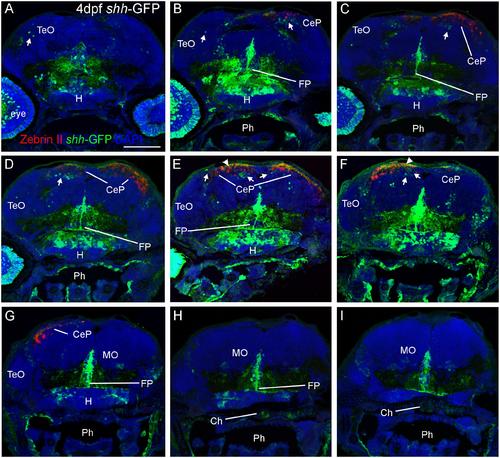
Confocal photomicrographs (maximum projections) of transverse sections from tectal (A) to hindbrain (I) levels of a shh-GFP zebrafish larva at 4 dpf immunostained for GFP (with DAPI as counterstain) reveals extent of cerebellum through additional immunostain with Zebrin II. Arrows: dorsal GFP expressing cells. Arrowheads point out GFP-expressing dendritic arborizations. Scale bar in (A): 100 µm (applies to all panels). CeP, cerebellar plate; Ch, notochord; FP, floor plate; H, hypothalamus; MO, medulla oblongata; Ph, pharynx; TeO, optic tectum. |
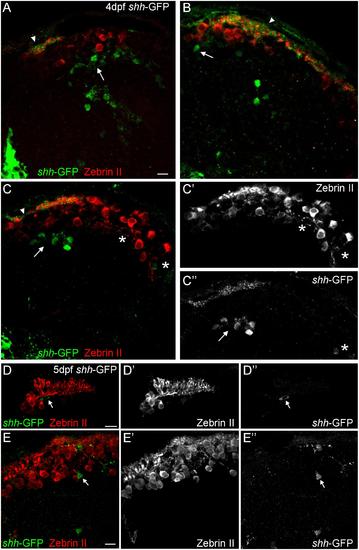
Confocal photomicrographs (optical sections) of transverse sections of shh-GFP zebrafish cerebellum immunostained for Zebrin II at 4 dpf (A-C) and 5 dpf (D,E) showing that Zebrin II is not seen in shh-GFP expressing cells at 4 and 5 dpf. Arrows point to GFP expressing cells. Arrowhead points out GFP-expressing dendritic arborizations. Scale bars: 10 µm, that in (A) also applies to (B,C). |
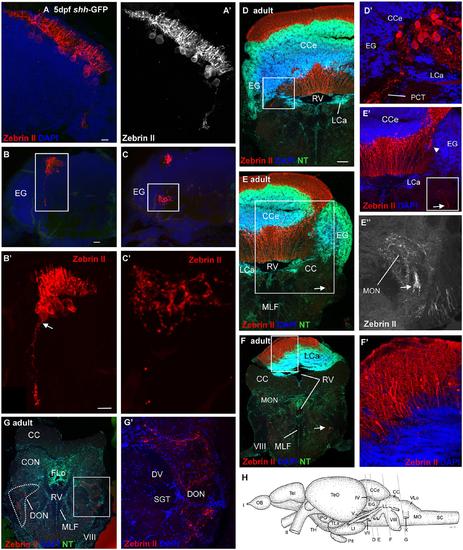
Confocal photomicrographs (maximum projections) of transverse sections of a shh-GFP zebrafish cerebellum at 5 dpf (A-C) and sections of a wild-type adult brain immunostained for Zebrin II with DAPI and Neurotrace (NT) as counterstains (D-G). (A) Right side of larval cerebellum shows location of Purkinje cell layer. Note large cell bodies and typical dendritic trees into molecular layer. (A′) Monochromatic picture visualizes Purkinje cell morphology. (B,C) This shows more caudal cerebellar levels including eminentia granularis. (B′) Enlargement of caudal Purkinje cells with one exhibiting an axon directed ventrally and exiting the cerebellum. (C′) Enlargement of terminal field in larval vestibular primary nuclear area formed by axon shown in (B′). Four transverse sections [levels indicated in drawing shown in (H)] from rostral (D) to caudal (G) show adult Purkinje cell bodies and dendrites in corpus cerebelli (D,E) and lobus caudalis cerebelli (F,F′), plus some Purkinje cells along the medial edge of eminentia granularis (arrowhead in E′). The cerebello-octavolateralis tract is highlighted by arrows in (E-E′′,F) and forms a terminal field in the medial octavolateralis nucleus (E-E′′) and in the descending octaval nucleus (G,G′). (D′) Enlargement of Purkinje cells giving rise to cerebello-octavolateralis tract (left brain side). See text for more details. Scale bars: 10 µm, that in (B) also applies to (C), in (D, also applies to E-G): 200 µm. CC, crista cerebellaris; CCe, corpus cerebelli; DV, descending trigeminal tract; CON, caudal octavolateralis nucleus; DON, descending octaval nucleus; EG, granular eminence; FLo, facial lobe; LCa, lobus caudalis cerebelli; LI, inferior lobe; LL, lateral line nerves; MO, medulla oblongata; MON, medial octavolateralis nucleus; MLF, medial longitudinal fascicle; OB, olfactory bulb; PG, preglomerular area; Pit, pituitary; RV, rhombencephalic ventricle; SC, spinal cord; SGT, secondary gustatory tract; Tel, telencephalon; TeO, optic tectum; TH, tuberal hypothalamus; TLa, torus lateralis; VLo, vagal lobe; I, olfactory nerve; II, optic nerve; IV, trochlear nerve; V, trigeminal nerve; VII, facial nerve; VIII, octaval nerve; X, vagal nerve. |
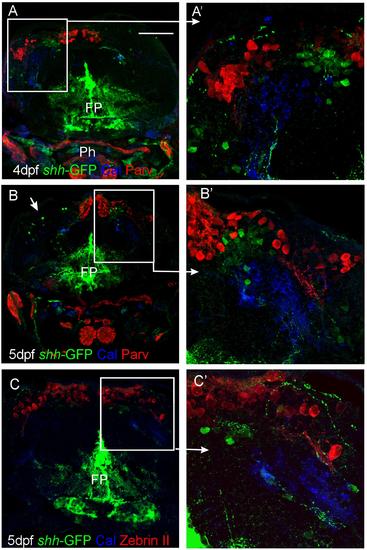
Confocal photomicrographs (optical sections) of transverse sections of shh-GFP zebrafish cerebellum at 4 and 5 dpf immunostained for calretinin/parvalbumin (A,B) or calretinin/Zebrin II (C) with corresponding enlargements to show cellular details (A′-C′). Arrows point out GFP-expressing cells. Scale bar: 100 µm (applies to B and C). FP, floor plate; Ph, pharynx. |
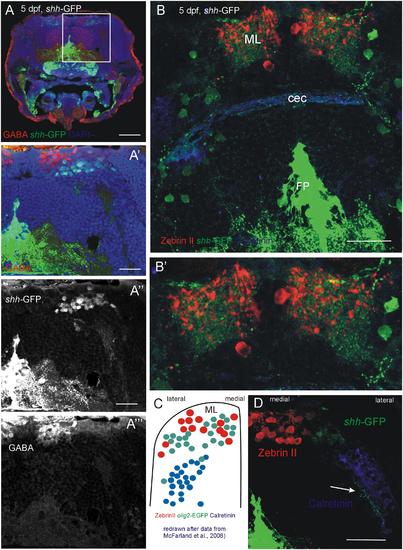
Confocal photomicrographs (optical sections) of transverse sections of 5 dpf larval shh-GFP zebrafish cerebellum immunostained for GABA (A-A′′′) or Zebrin II and Calretinin (B,B′,D). (C) Shows a drawing of data published by McFarland et al. (2008) to show correspondences of cerebellar cell populations shown in the present paper. Note stained axons of shh-GFP cells in (D; arrow). See text for details. Abbreviations: cec, cerebellar commissure; FP, floor plate; ML, molecular layer. Scale bars in (A): 100 µm, in (B,D): 50 µm, in (A′): 20 µm. |
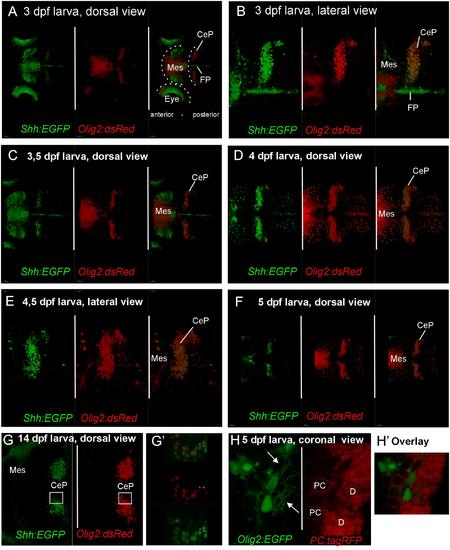
Confocal live imaging of double-transgenic zebrafish larvae, i.e., Tg(olig2:dsred2)vu19/Tg(2.4shha-ABC-GFP)sb15 specimen, shows temporal development of shh-GFP and olig2-dsRed marked cells from 3 to 14 dpf (A-G). (A-F) Each panel shows two single label and one merged picture, (G) shows two single label pictures, with G′ showing an enlarged overlay (optical section). Note that double labeled cells are restricted to the cerebellar plate and are absent from the midbrain. (H) is taken from a double-transgenic Tg(olig2:EGFP)/Tg(PC:FyntagRFP-T) larval zebrafish specimen at 5 dpf and shows a lateral region in the cerebellar plate. Note that olig2-EGFP expressing eurydendroid cells (green) lie close to PC-tagRFP positive Purkinje cells (red), but are never co-labeled. Note that green eurydendroid cells show dendrites extending into the molecular layer (arrows). (H′) shows an overlay. CeP, cerebellar plate; D, dendritic tree; FP, floor plate; Mes, mesencephalon (midbrain); PC, Purkinje cell body. |
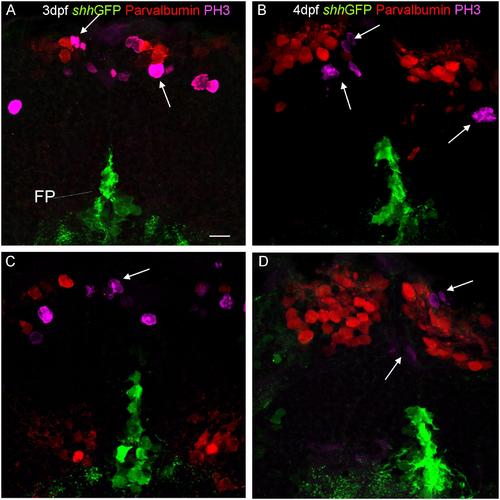
Confocal photomicrographs (optical sections) of transverse sections of shh-GFP zebrafish cerebellum at 3 dpf (A,C) and 4 dpf (B,D) immunostained for parvalbumin and PH3. Arrows point out mitotic PH3 positive cells which are neither GFP nor parvalbumin positive. Scale bar in (A): 10 µm (applies to all panels). |
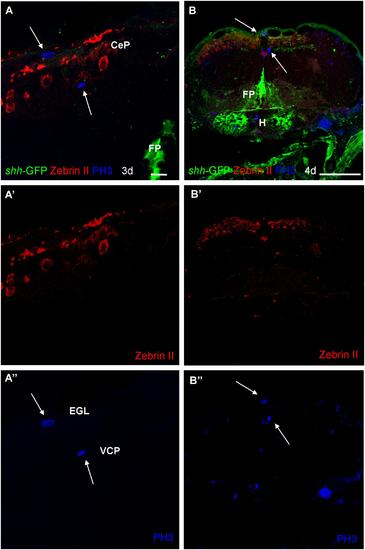
Photomicrographs (optical sections) of transverse sections of shh-GFP zebrafish cerebellum at 3 and 4 dpf immunostained for Zebrin II and PH3. Arrows point to mitotic PH3 positive cells which are never Zebrin II positive and lay basal or superficial to them. Scale bar in (A): 10 µm (also applies to A′, A′′) and in (B): 100 µm (also applies to B′, B′′). CeP, cerebellar plate; EGL, external granular layer; FP, floor plate; H, hypothalamus; VCP, ventral (ventricular) cerebellar proliferation zone. |
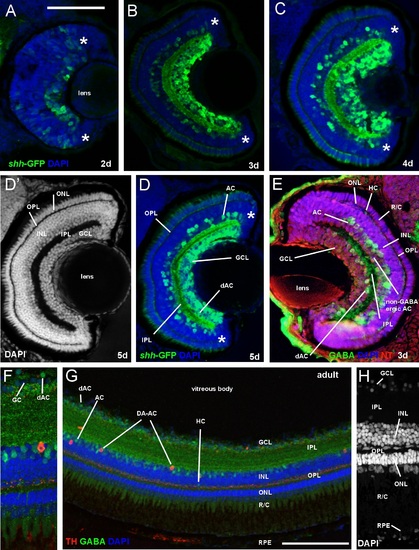
Comparison of retina of zebrafish shh-GFP line with immunostained wildtype larval and adult zebrafish (confocal photomicrographs, except E). (A-D) Sections of retina in transgenic zebrafish at 2, 3, 4, and 5 dpf show GFP-positive amacrine and ganglion cells in addition to fiber net in internal plexiform layer. (D′) Same section as (D) shows retinal layers. Note monolayer of photoreceptors and multiple ganglion cell layers. (E) Wildtype larval zebrafish retina stained immunohistochemically for GABA, visualizing amacrine (incl. some that are displaced into ganglion cell layer) and a few horizontal cells. (FH) Wildtype adult zebrafish retina stained immunohistochemically for GABA and tyrosine hydroxylase (TH) visualizing amacrine cells. Magnification in (F) shows GABAergic amacrine cells in inner nuclear layer and displaced ones (green) next to ganglion cells (blue) and one dopaminergic amacrine (interplexiform) cell (red). Note the latter′s dendritic punctate staining in the inner part of the outer plexiform layer. Magnification in (H) shows cell somata layers with DAPI. Note in inner nuclear layer the lighter stain of amacrine cells compared to bipolar cells and the elongated shape of horizontal cells. Counterstains: DAPI and NeuroTrace (NT). Asterisks: proliferative retinal edge. Scale bar in (A): 100µm (applies to panels B-E), in (G): 50µm. Abbreviations: AC amacrine cells (retina), dAC displaced amacrine cells, DA-AC dopaminergic amacrine (interplexiform) cells, GC ganglion cell, GCL ganglion cell layer, HC horizontal cells, INL inner nuclear layer, IPL inner plexiform layer, ONL outer nuclear layer, OPL outer plexiform layer, R/C rods/cones (inner & outer segments), RPE retinal pigment epithelium |
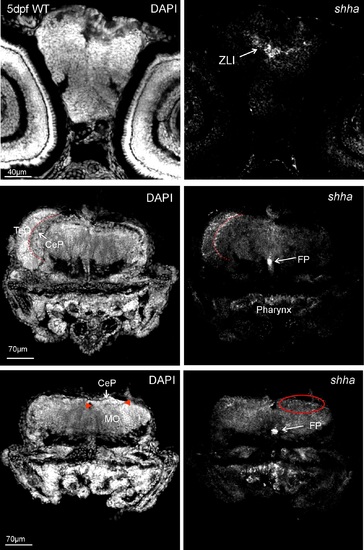
Zebrafish (wild type, WT) brain section in-situ hybridized for shha at 5 dpf and analyed with confocal microscopy shows expected expression domains (right panels). Left panels: corresponding DAPI pictures for anatomical identification. Upper row: level of zona limitans intrathalamica (ZLI). Middle row: level of optic tectum (TeO) and cerebellar plate (CeP; boundary shown by red stippled line) shows shha expressing cells in floor plate (FP) and cerebellar plate, as well as in pharynx. Bottom row: level of posterior cerebellar plate (boundary towards medulla oblongata, MO, indicated by red arrowheads in left panel), shha expressing cells in FP and cerebellar plate (encircled in red), as well as in pharynx. |
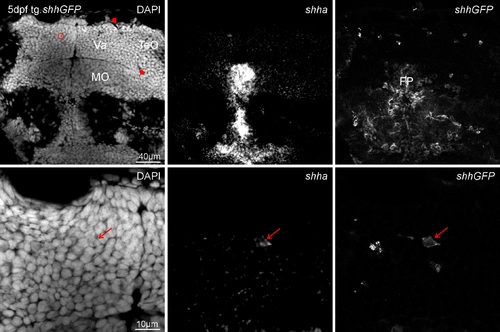
Zebrafish transgenic shh-GFP line brain sections in-situ hybridized for shha at 5 dpf and analyed with confocal microscopy shows shha expression domains as seen in WT (compare to Supplementary Fig. 2) to largely overlap with GFP. Upper row shows overview of valvular cerebellar (Va) level, bottom row is an enlargement. Left panels: DAPI, middle panels: shha, right panels: shhGFP. Red arrowheads indicate border between optic tectum (TeO) and valvula (Va), red circle indicates region of interest. Medulla oblongata is separated from cerebellum by rhombencephalic ventricular space. Importantly, there are dorsal cerebellar cells double-labeled for the transgene (shhGFP) and the in-situ signal (shha, red arrows). |