
- Title
-
Genome-wide analysis reveals NRP1 as a direct HIF1α-E2F7 target in the regulation of motorneuron guidance in vivo
- Authors
- de Bruin, A., Cornelissen, P.W., Kirchmaier, B.C., Mokry, M., Iich, E., Nirmala, E., Liang, K.H., Végh, A.M., Scholman, K.T., Groot Koerkamp, M.J., Holstege, F.C., Cuppen, E., Schulte-Merker, S., Bakker, W.J.
- Source
- Full text @ Nucleic Acids Res.
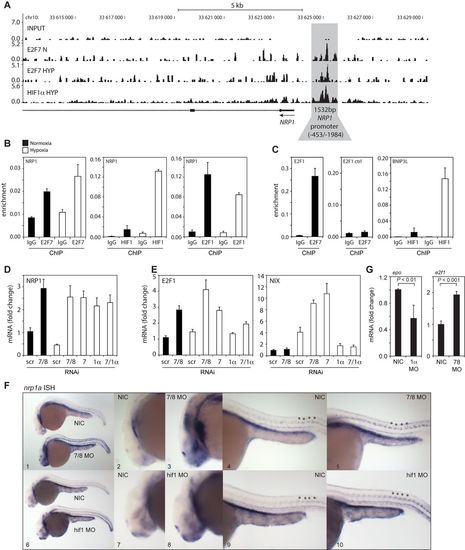
In vitro and in vivo validation of NRP1 regulation by HIF1α and E2F7. (A) ChIP-seq signal (y-axis: peak height) shown for E2F7 (N and HYP) and HIF1α (HYP) on the NRP1 promoter (indicated in grey). Input DNA was sequenced as a control. Lines underneath the graphs indicate annotated genes, boxes present exons and lines with arrows indicate introns. Arrow indicates direction of transcription. (B) Validation of HIF1α, E2F7 and E2F1 enrichment on the NRP1 promoter as analyzed by ChIP-qPCR in normoxic or hypoxic HeLa cells. Isotype matched IgG served as a negative control. (C) Positive controls for ChIP: binding of E2F7 to the E2F1 promoter, and HIF1α binding to the BNIP3L promoter. A non-specific region 700 bp upstream of the E2F binding site in the E2F1 promoter served as a negative control. (D) Graph shows NRP1 mRNA levels as determined by qPCR in lysates isolated from HeLa cells transfected with control (scr), E2F7 and E2F8 (7/8), E2F7 (7), HIF1α (1α) or E2F7 and HIF1α (7/1α). (E) Same as (D) but now for E2F1 and NIX mRNA levels, positive controls for E2F7 and HIF1α, respectively. (F) In situ hybridizations (ISH) for nrp1a using non-injected control (NIC), e2f7/8 MO (5 + 5 ng, n = 46), or hif1ab MO (5 ng, n = 70) injected zebrafish embryos, obtained from three independent experiments. e2f7/8 MO and NIC littermates were analyzed at 26 hpf, hif1ab MO injected and NIC littermate embryos at 28 hpf. 100% of the e2f7/8 MO injected embryos, and 69% of the hif1ab MO injected embryos showed enhanced nrp1a expression in MN. All panels show lateral views. Panels 2, 3, 7 and 8 show magnifications of the head region. Panels 4, 5, 9 and 10 show magnifications of the trunk region. Asterisks show examples of spinal motorneurons. (G) Graphs show fold change of epo or e2f1 mRNA expression in hif1ab MO (1α) or e2f7/8 (7/8) injected zebrafish embyros, respectively, compared to NIC. mRNA levels were determined in >30 embryos from three independent experiments. All quantified data present the average ± S.D. compared to the indicated controls in at least three independent experiments. |
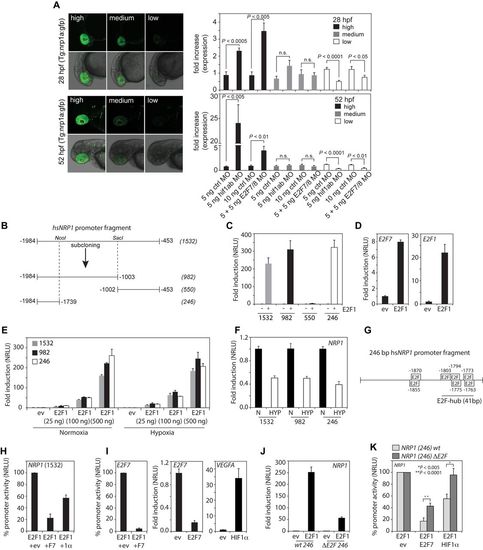
The HIF1α-E2F7 complex regulates NRP1 through an E2F-hub. (A) Left panels show confocal images of the head region of Tg(nrp1a:gfp)js12 zebrafish at 28 and 52 hpf. Fish are divided in three groups (high, medium, low) based on the level of transgene expression in the eye (showing 2 examples per group). Graphs present quantification of the three groups at the indicated times after injection of control MO, e2f7/8 MO (5 + 5 ng) or hif1α MO (5 ng) in zebrafish embryos (n ≥ 154 embryos in ≥ 4 independent experiments for each specific condition). (B) Schematic figure of the cloned 1532 bp human NRP1 promoter, and promoter regions subcloned from it, using NcoI and SacI restriction sites. (C) Luciferase reporter assays showing the fold induction of normalized relative luciferase units (NRLU) of different NRP1 promoter constructs by E2F1 compared to controls. (D) Similar as in (C) but now for the E2F1 control promoters E2F7 and E2F1. (E) Reporter assay showing the dose-dependent induction of the NRP1 promoter activity by different amounts of E2F1. (F) Reporter assay comparing the activity of the indicated NRP1 promoter constructs in hypoxia compared normoxia. (G) Representation of the 246 bp NRP1 promoter and putative E2F binding sites as identified by MatInspector. HIF binding sites were not identified in the 246 bp fragment. (H) Reporter assay showing activity of the 1532 bp NRP1 promoter in the presence of E2F1 alone (set at 100%) or together with E2F7 or HIF1α (1α). (I) Control reporter assays showing regulation of the E2F7 promoter (left panel) promoter in the presence of E2F1 alone (set at 100%), or together with E2F7. Middle and right panels show positive controls to check for functional E2F7 or HIF1 activity using E2F1 or VEGFA promoter constructs respectively. (J) Reporter assay showing induction of the wild-type and theΔE2F-hub NRP1 promoter by E2F1 compared to controls. (K) Similar as in (H) but now for the wildtype or 41 bp E2F-hub deleted (ΔE2F) 246 bp NRP1 promoter. All quantified data present the average ± S.D. (except for (A) in which the average ± S.E.M. as shown) compared to the indicated controls in at least three independent experiments. |

ZFIN is incorporating published figure images and captions as part of an ongoing project. Figures from some publications have not yet been curated, or are not available for display because of copyright restrictions. |
|
ZFIN is incorporating published figure images and captions as part of an ongoing project. Figures from some publications have not yet been curated, or are not available for display because of copyright restrictions. |