- Title
-
Tcf7l2 Is Required for Left-Right Asymmetric Differentiation of Habenular Neurons
- Authors
- Hüsken, U., Stickney, H.L., Gestri, G., Bianco, I.H., Faro, A., Young, R.M., Roussigne, M., Hawkins, T.A., Beretta, C.A., Brinkmann, I., Paolini, A., Jacinto, R., Albadri, S., Dreosti, E., Tsalavouta, M., Schwarz, Q., Cavodeassi, F., Barth, A.K., Wen, L., Zhang, B., Blader, P., Yaksi, E., Poggi, L., Zigman, M., Lin, S., Wilson, S.W., Carl, M.
- Source
- Full text @ Curr. Biol.
|
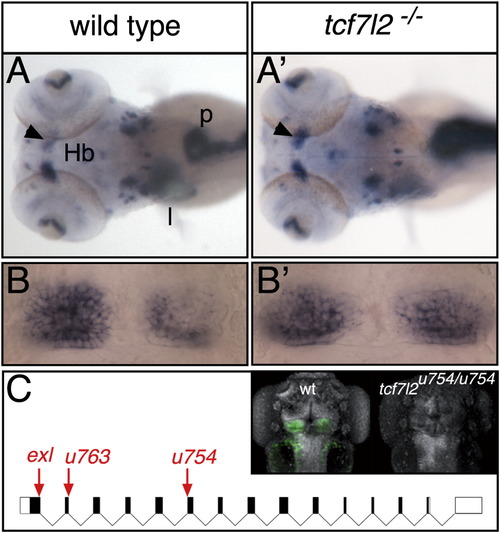
tcf7l2 Is Required for the Establishment of Habenular Asymmetry (A and A′) Dorsal views of 4 dpf (days postfertilization) embryos, with anterior to the left, labeled with a cocktail of markers that reveal habenular asymmetry (kctd12.1) and position of liver (sepB) and pancreas (trypsin). The arrowheads indicate normal (A) and increased (A′) kctd12.1 expression in the right habenula. (B and B′) Dorsal views of the habenulae with anterior to the top showing symmetric kctd12.1 expression in a wild-type fry (B) and a tcf7l2 mutant (B′). (C) Diagram of intron/exon structure for tcf7l2 showing the tcf7l2exl [26], tcf7l2u763, and tcf7l2u754 alleles. Arrows point to mutation sites. The inset shows dorsal views, with anterior to the top, of 4 dpf wild-type (wt) and tcf7l2u754/u754 mutant embryos stained for Tcf7l2 (green) and Sytox orange (gray). Hb, habenula; l, liver; p, pancreas. See also Figure S1. |
|
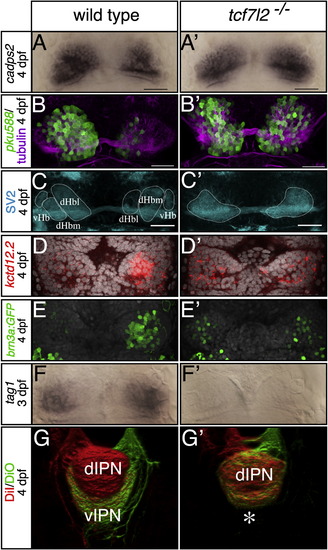
tcf7l2 Mutants Show LR Symmetric Patterns of Epithalamic Neuron Differentiation (A–F′) Dorsal views, with anterior to the top, of the habenulae of embryos labeled with markers at stages shown to the left. In (D–E′), nuclei (gray) are labeled with Topro3 and Sytox orange, respectively. All markers are symmetric in tcf7l2 mutants. Scale bars in (A)–(C′) represent 25 µm. (G and G′) Dorsal views of 3D reconstructed confocal images of lipophilic-dye-labeled left (red) and right (green) habenular axons terminating in the IPN. The asterisk highlights the lack of axon terminals normally innervating the ventral IPN. dHbl and dHbm, lateral and medial habenular subnucleus, respectively; dIPN and vIPN, dorsal and ventral interpeduncular nucleus, respectively; vHb, ventral habenular subnucleus. See also Figures S2 and S3 and Table S1. EXPRESSION / LABELING:
PHENOTYPE:
|
|
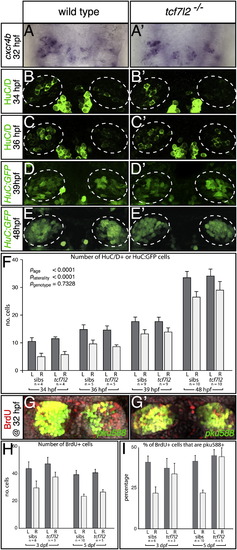
Habenular Neurogenesis Is Not Overtly Affected in tcf7l2 Mutants (A–E′, G, and G′) Dorsal views of the epithalamus, with anterior to the top. (A and A′) The numbers and LR asymmetry of cxcr4b-expressing dHb neuronal precursors is not overtly affected in the tcf7l2 mutant. (B–E′) HuC/D (B–C′) and transgenic HuC:GFP (D–E′) expression in differentiating habenular neurons in wild-type fry and tcf7l2 mutants. The dotted circles highlight the dHb. (F) Numbers of HuC/D+ and HuC:GFP+ neurons are not significantly different between wild-type embryos and tcf7l2 mutants at 34, 36, 39, and 48 hpf. Error bars indicate the SEM. (G and G′) BrdU (red)-labeled, 5 dpf dHb neurons expressing the pku588 transgene (green) in a wild-type (G) and a tcf7l2 mutant (G′). (H and I) Graphs representing the number of BrdU-labeled cells (H) and the percentage of BrdU-labeled cells coexpressing the pku588 transgene (I) in wild-type embryos and tcf7l2 mutants. Error bars indicate the SD. See also Table S2. |
|
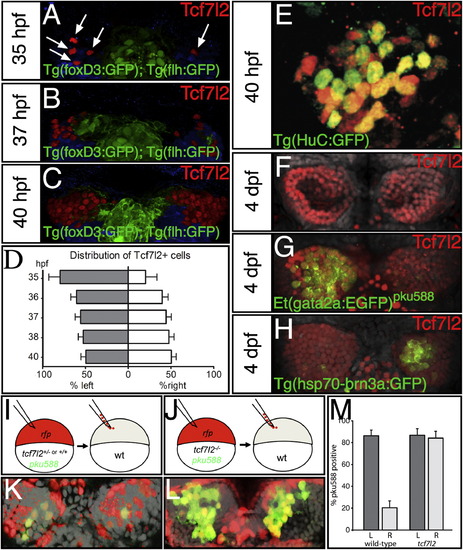
Tcf7l2 Is Expressed in Both Left- and Right-Sided dHbl and dHbm Neurons and Functions Cell/Lineage Autonomously (A–C, E–H, K, and L) Dorsal views with anterior to the top of the epithalamus at ages indicated and at 54 hpf (K and L). (A–D) Numbers of Tcf7l2 expressing cells (arrows in A) in Tg(foxD3:GFP); Tg(flh:eGFP) transgenic embryos are asymmetrically distributed in 35 and 37 hpf embryos (A and B) but are symmetric by 40 hpf (C and graph in D). Tcf7l2 expressing cells ventral to the habenulae are pseudocolored in blue. (E) High magnification of the left habenula stained for Tcf7l2 (red) and HuC:GFP (green). (F–H) Tcf7l2 expression (red) in wild-type (F), Et(gata2a:EGFP)pku588 (G), and Tg(hsp70-brn3a:GFP) (H) embryos colabeled with Sytox orange (gray nuclei). (I and J) Schematics of the experiment. RFP+ wild-type (I) or tcf7l2 mutant (J) cells carrying the pku588 transgene were transplanted into nontransgenic hosts in a region of the blastula from which cells later contribute to the habenulae. (K and L) Examples of transplanted control Et(gata2a:EGFP)pku588 × tcf7I2+/ or tcf7I2+/+ (K) and Et(gata2a:EGFP)pku588 × tcf7I2/ (L) cells (donor cells are red) in wild-type habenulae (nuclei labeled gray with DAPI). (M) dHb neurons from mutant donors expressing the pku588 transgene when incorporated into either the left or right habenula. Error bars represent the SD of the cell proportions. See also Figure S4 and Table S2. |
|
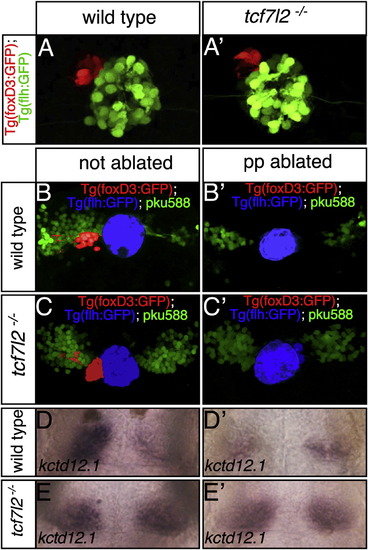
The Symmetric dHb Phenotype of tcf7l2 Mutants Is Epistatic to Parapineal Ablation Dorsal views focused on the epithalamus of 2.5 dpf (A and A′) and 4 dpf (B–E′) embryos with anterior to the top. (A and A′) The parapineal (pseudocolored red) is on the left in both wild-type and tcf7l2 mutant embryos. (B–E′) In Et(gata2a:EGFP)pku588; Tg(foxD3:GFP); Tg(flh:eGFP) triple-transgenic normal and parapineal-ablated embryos, dHbl neurons (green) and the pineal complex are labeled. The pineal is pseudocolored in blue and the parapineal and its projections in red (B–C′). Embryos as in (B)–(C′) were labeled for kctd12.1 subsequent to live imaging (D–E′). |
|
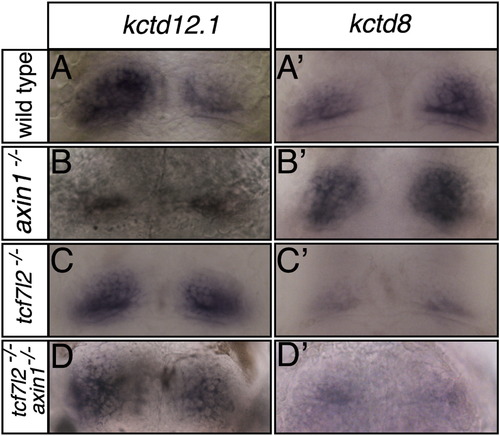
The dHb Phenotype of tcf7l2 Mutants Is Epistatic to the Effects of a Mutation in axin1 that Enhances Wnt Signaling Dorsal views of the habenulae of 4 dpf embryos of genotype shown to the left labeled with markers shown above columns (A–D′). The enhanced expression of kctd12.1 and reduced expression of kctd8 in tcf7l2 mutants is observed irrespective of the presence (C and C′) or absence (D and D′) of functional Axin1. See also Table S3. EXPRESSION / LABELING:
|
|
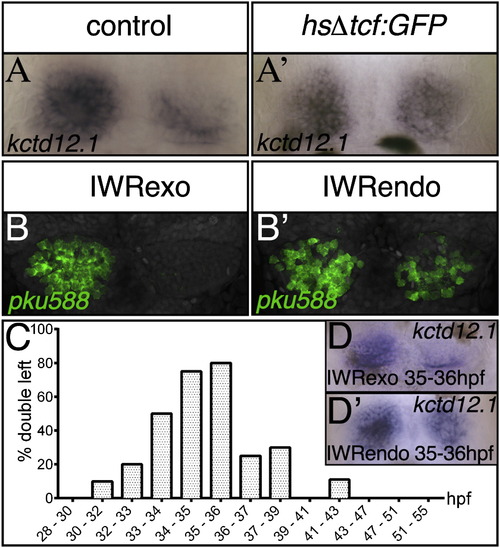
Wnt Signaling Is Required to Suppress dHbl Character in Right-Sided Neurons at the Onset of Tcf7l2 Expression (A–B′, D, and D′) Dorsal views with anterior to the top of 4 dpf embryos showing the upregulation of kctd12.1 expression in the right habenula of a heat-shock-treated GFP+ Tg(hsp70:Δtcf-GFP) embryo (A′). The pku588 transgene and kctd12.1 are upregulated on the right side in IWRendo-treated embryos (B2 and D2). Control embryos were heat shocked or treated with IWRexo (A, B, and D). (C) Graph showing timing of IWRendo treatment and percentage of embryos with increased kctd12.1 expression in the right habenula. See also Figure S5 and Table S4. EXPRESSION / LABELING:
|

