
- Title
-
Developmental expression of the Nfe2-related factor (Nrf) transcription factor family in the zebrafish, Danio rerio
- Authors
- Williams, L.M., Timme-Laragy, A.R., Goldstone, J.V., McArthur, A.G., Stegeman, J.J., Smolowitz, R.M., and Hahn, M.E.
- Source
- Full text @ PLoS One
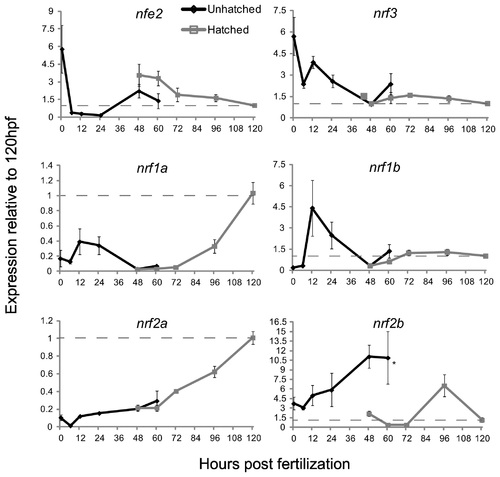
The expression of the nrf gene family during development as measured by quantitative real-time PCR. Black lines indicate expression pre-hatch and grey lines indicate expression post-hatch. Values were normalized to the 120 hpf time-point and β-actin 1 (actb1) was used as the housekeeping gene. Data are presented as the mean ± S.E.M. (error bars), and N = 4 pools of 30 embryos. Differences in expression between hatching state were assessed using ANOVA followed by Fisher′s PLSD (*, p ≤ 0.05). Data for expression of nrf2a and nrf2b are from Timme-Laragy et al. [7] and are used with permission of the American Society for Biochemistry and Molecular Biology. Previously these data were presented as molecule number. Here we have normalized the data to β-actin 1 expression and to the 120 hpf time point and re-plotted for comparison to the new data on expression of other nrf family genes. Dashed lines indicate the value of 1.0 from the 120 hpf time point. |
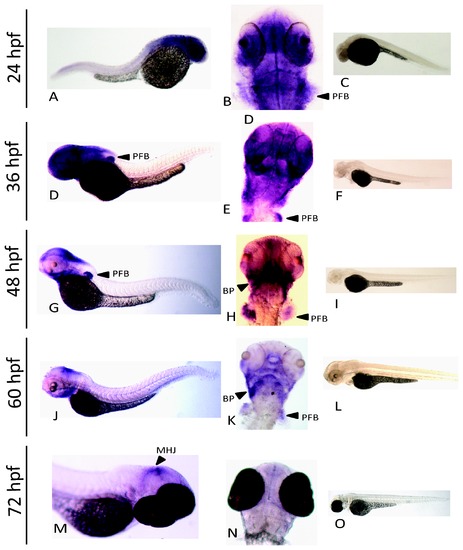
Expression of nrf3 during development as assessed by whole mount in situ hybridization. An anti-sense probe was used to determine the spatial expression of nrf3 at 24 hpf (A,B), 36 hpf (D,E), 48 hpf (G,H), 60 hpf (J,K), and 72 hpf (M,N). Paired sense controls are shown for each time point as well (C,F,I,L,O). Arrows indicate specific features identified by in situ hybridization: pectoral fin bud (pfb), branchiogenic primordia (bp), and mid hindbrain junction (mhj). EXPRESSION / LABELING:
|

Effects of Nfe2 knockdown on swim bladder inflation and histology. Thirty larvae were sampled at 96 hpf after being injected as embryos with either control morpholino (A) or nfe2 morpholino (B) and histological analysis was conducted on eight larvae from each treatment. Normal histology is shown for larvae injected with control MO (C,D). In larvae with Nfe2 knocked down, cellular disorganization is shown in the mucus cells lining the esophagus (E). Scale bars represent 25 μm (D) and 30 μm (E). In (C), (D), and (E), cellular structures are numbered as follows: 1: pneumatic duct; 2: notochord; 3: swim bladder; 4: gastrointestinal lumen; 5: yolk; 6: normal columnar epithelium; 7: irregular, disordered epithelium lacking well developed mucus cells; 8: irregular epithelium. Anterior (A), posterior (P), dorsal (D), and ventral (V) are also labeled. PHENOTYPE:
|

Otic Vesicle Defects in nfe2 morphants. Otic vesicles were laterally imaged at 30 hpf (panel A, D), 48 hpf (panel B, E), and 72 hpf (panel C, F) following injection of control MO (panels A, B, C) or nfe2-MO-1 (panels D, E, F) at the one to four-cell stage. Otoliths are marked with an arrowhead and projections of epithelium forming the semicircular canal system are noted with an arrow in panel B. The fusion of the canal system is noted by an arrow in panel C. Scale bars equal 50 μm. PHENOTYPE:
|
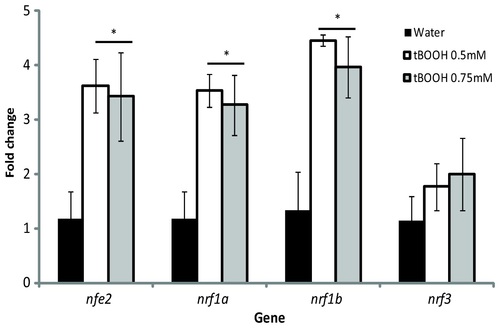
Expression of nrf genes following tBOOH exposure at 96 hpf. Larvae were exposed to either water (black bars), 0.5mM tBOOH (white bars), or 0.75mM tBOOH (grey bars) for 6 hours and then sampled. Values were normalized to the water control within each gene and β-actin 1 was used as the housekeeping gene. Fold change data are presented as the mean ± S.E.M. (error bars), and N = 3 pools of 25 embryos. Data were analyzed using ANOVA and Fisher′s PLSD (*, p ≤ 0.05). EXPRESSION / LABELING:
|
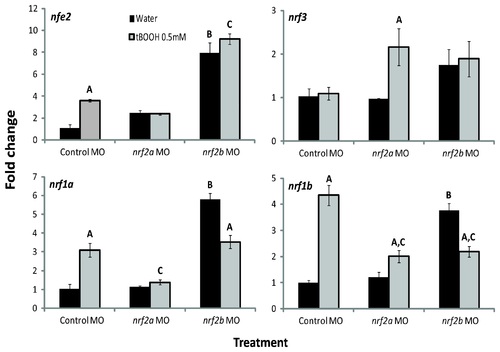
Effects of tBOOH and Nrf2a and Nrf2b morpholino treatment on nrf gene expression. Embryos were injected at the one- to four-cell stage with control-MO, nrf2a-MO, or nrf2b-MO and then treated with either water or 0.5 mM tBOOH for 6 hours starting at 96 hpf. Values were normalized to the control (embryos injected with control-MO and treated with water) within each gene; β-actin 1 (actb1) was used as the housekeeping gene. Fold change data are presented as the mean ± S.E.M. (error bars), and N = 3 pools of 25 embryos. Data were analyzed using ANOVA and Fisher′s PLSD (A, difference between water and tBOOH within a MO treatment; B, difference between control MO with water treatment and nrf2b MO with water treatment; C, difference control MO with tBOOH treatment and either nrf2a or nrf2b MO with tBOOH treatment; p ≤ 0.05). EXPRESSION / LABELING:
|