
|
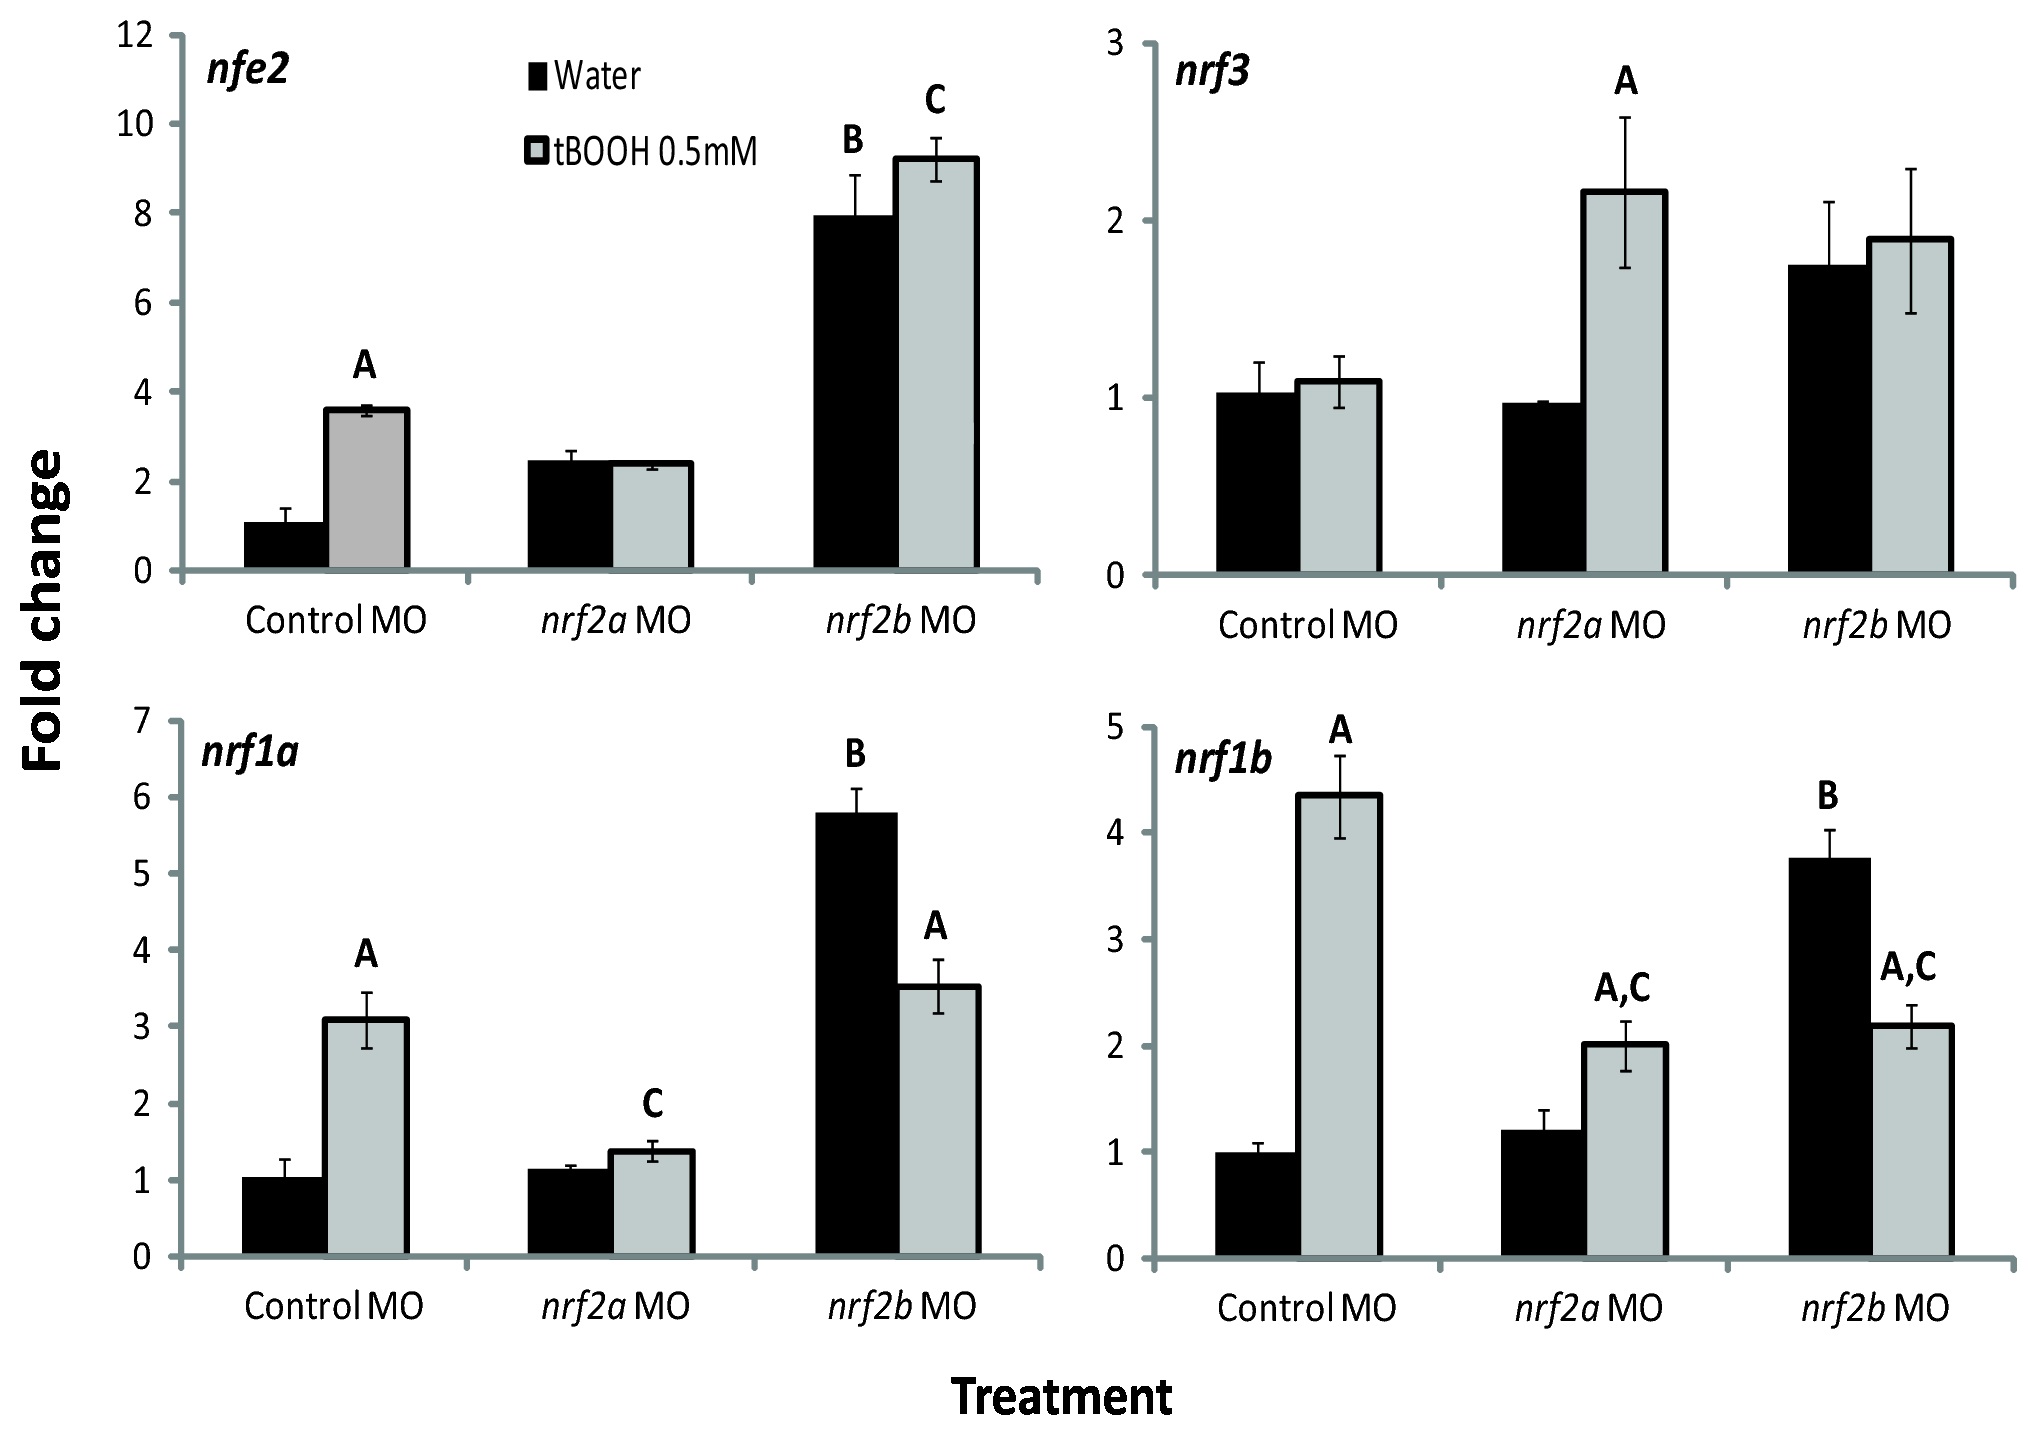
Fig. 9
Effects of tBOOH and Nrf2a and Nrf2b morpholino treatment on nrf gene expression.
Embryos were injected at the one- to four-cell stage with control-MO, nrf2a-MO, or nrf2b-MO and then treated with either water or 0.5 mM tBOOH for 6 hours starting at 96 hpf. Values were normalized to the control (embryos injected with control-MO and treated with water) within each gene; β-actin 1 (actb1) was used as the housekeeping gene. Fold change data are presented as the mean ± S.E.M. (error bars), and N = 3 pools of 25 embryos. Data were analyzed using ANOVA and Fisher′s PLSD (A, difference between water and tBOOH within a MO treatment; B, difference between control MO with water treatment and nrf2b MO with water treatment; C, difference control MO with tBOOH treatment and either nrf2a or nrf2b MO with tBOOH treatment; p ≤ 0.05).