
- Title
-
Longitudinal fluorescent observation of retinal degeneration and regeneration in zebrafish using fundus lens imaging
- Authors
- Duval, M.G., Chung, H., Lehmann, O.J., and Allison, W.T.
- Source
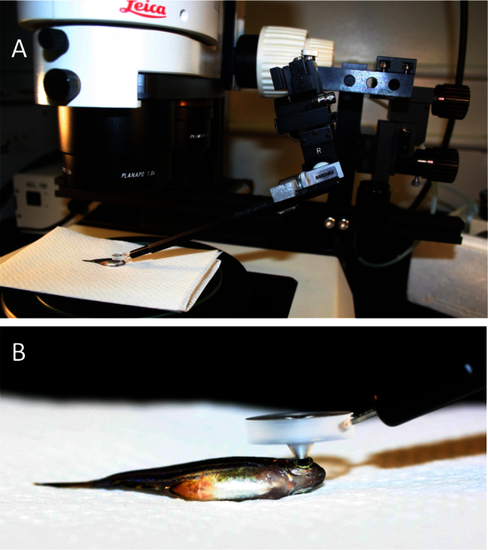
Mounting of a custom fundus lens on a fluorescent stereomicroscope allows characterization of individual photoreceptor cells in vivo. A: An adult anaesthetized zebrafish is shown, positioned on its flank under the objective lens such that its pupil is in the centre of the field-of-view. The fundus lens is positioned in the light path, centered above and touching the pupil (detailed in B). A micromanipulator (right side of image) allows precise and constant positioning of the fundus lens but is not required. B: A view of the custom fundus lens in position for viewing, positioned on the fish eye. The ventral side of the fish is in view. |
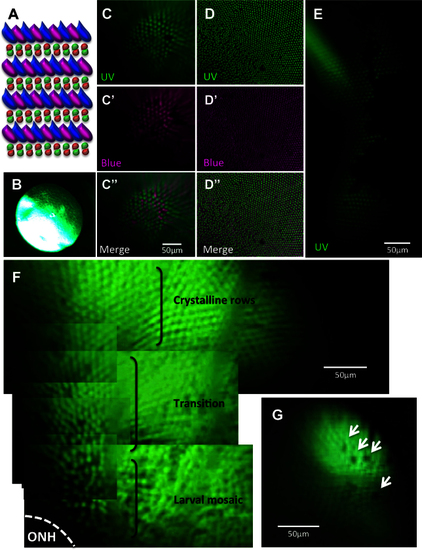
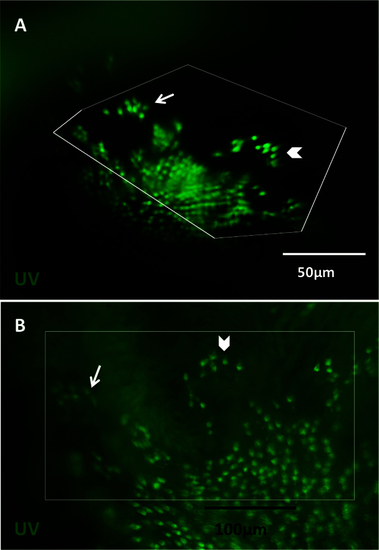
Viewing the cone mosaic in vivo. A: The cone row mosaic is shown as a schematic (with ultraviolet-sensitive (UV) cones in magenta and blue-, green- and red- sensitive cones coloured as per their respective spectral sensitivity; not to scale). B. The best possible picture equivalent to C acquired without the fundus lens, using standard stereomicroscope optics. C. The cone mosaic can be successfully imaged in vivo; The example here is from fish transgenic for green fluorescent protein (GFP; C) and mCherry [C′] in UV- and blue-sensitive cones, respectively, and merging the two channels [C′′] with mCherry signals pseudocoloured to magenta. D: An ex vivo image of a flat-mounted retina dissected away from other ocular tissues is presented for comparison to [C, D], [D′] and [D′′] show GFP, mCherry and merged channels, respectively. E: Details are visible in vivo after cell ablation, such as lesion edges where GFP-labeled cones have died, leaving clear gaps in the cone mosaic. F: A panorama assembled from stills taken in Appendix 2 (0:08-0:12) depicts several features, including: the crystalline rows of UV cones in the adult row mosaic; the larval mosaic, which does not contain rows; and a transition zone between the mosaics. The optic nerve head (ONH) is located at the bottom left of the panorama. G: An image of UV cone rows with gaps, representing individual absent cones, which was regularly observed. Appendix 1 showing intact photoreceptors, and Appendix 2 of one intact and two lesioned photoreceptor layers, can be found online. n=4 fish shown in this image. |
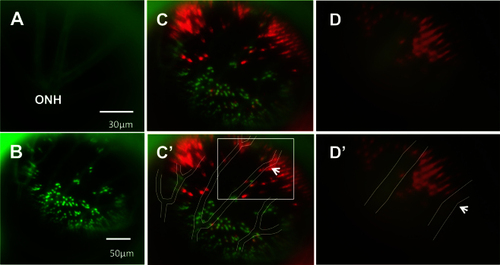
Using vasculature patterns as in vivo landmarks to navigate within the eye. A: An in vivo view of the optic nerve head (ONH) is represented by the apparent convergence of vessels. From the ONH, vessel branching patterns were utilized to record and relocate areas of interest. B: A low-magnification image of the green fluorescent protein (GFP) channel is presented, showing the branching pattern of vessels that is used to navigate during imaging. Due to the difference in focal planes of the vessels and photoreceptor layer, the apparent positions of individual photoreceptors may shift slightly relative to the vessels. C: The same image in B is presented with GFP and mCherry channels merged and vessels outlined in white for clarity [C′]. Due to discrepancies in focal plane between the photoreceptor layer and the vessels, relative positions of some small areas of interest and neighbouring vessels differ slightly between images and between magnifications. To illustrate this, an area of interest, a bay-shaped lesion edge, was imaged at different magnifications. In C′, the area of interest is located between two vessel branches (white box). D: The area, imaged at high magnification, is shown without [D] and with vessels outlined [D′]. At high magnification, the area lies underneath one of the vessel branches (arrows indicate the same branch in each image), an apparent a shift of approximately 57 μm. n=2 fish shown. |
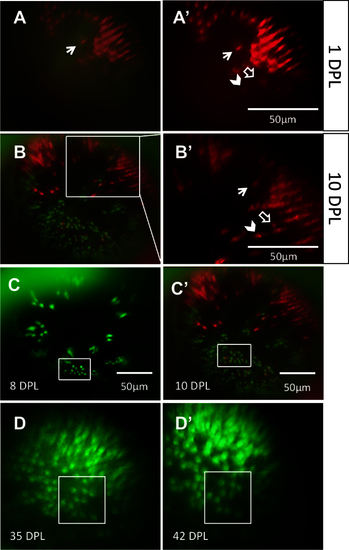
The same locations on the retina can be recovered and viewed on subsequent days. Through a combination of approximate relocation using vessel branch patterns and more precise relocation using unique lesion edge patterns, areas of interest were reexamined at multiple time points. A: In the mCherry channel (blue-sensitive cones), a lesion edge reminiscent of a bay shape, and a single cone within the bay (arrow), was observed at 1 day post-lesion (DPL). Image in A is a merge of the green fluorescent protein (GFP) and mCherry channels; A′ shows the mCherry channel alone. B: The same bay-shaped lesion edge was relocated at 10 DPL. B is a merge of the GFP and mCherry channels; B′ shows a higher magnification of the white box in B, in the mCherry channel alone. The single cone (arrow) was also identified. The appearance of a new blue-sensitive cone between 1 DPL [A′] and 10 DPL [B′] is indicated with an empty arrow. The chevron indicates a potential surviving cone, but the faint signal from this location at 1 DPL puts to question if the cone died and was replaced by the bright cone seen at 10 DPL. C: An area containing uniquely-shaped patches of surviving ultraviolet-sensitive cones is observed at 8 DPL (top) and relocated at 10 DPL (bottom). The same collection of ultraviolet-sensitive cones, and the same individual cones, was identified (white boxes) at both days. D: An area of regenerated UV cones showing the loss of row mosaic organization, imaged at 35 and 42 DPL (panel D and D;′, respectively); matching clusters of cones are indicated with white boxes. For an example of the outlined vessels and how areas were located using vasculature, see Figure 3. n=2 fish shown. |
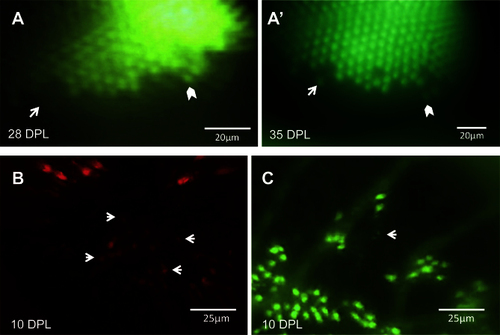
Changes in the retina over time can be captured in the same eye. A: An unltraviolet-sensitive (UV) cone that regenerated between 28 days post-lesion (DPL) [A] and 35 DPL [A′] is indicated with white arrows. White chevrons indicate the same cone in both panels, used to match the areas on different days. B: Faint spots of fluorescence (some examples shown with arrows) suggest that new blue-sensitive cones are beginning to express sws2 opsin (mCherry) at 10 DPL, and appear smaller and fainter than the surviving cones seen at the lesion edge in upper half of image. C: The same retina as shown in B, in the GFP channel; the white arrow indicates one or two new UV-sensitive cones beginning to express sws1 opsin. Faint GFP expression of new UV cones, alongside cones with robust expression, can be viewed in Appendix 3. n=2 fish shown. |
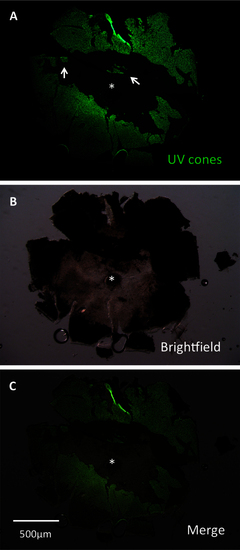
A lesioned retina was dissected to assess efficacy of lesioning methods. This retina was dissected at 3 days post-lesion (DPL) and flatmounted for imaging. Lesioning occurred across the eye. Lesion edges were observed to vary between clean, straight edges (center of retina) and variable shapes (left and right edges, representing periphery of retina). Patches of surviving cones (arrows) were commonly observed. A: The image is presented showing green fluorescent protein (GFP), which is contained in ultraviolet-sensitive (UV) cones. B: A brightfield view of the same retina. C: A merge of images A and B is presented. The asterisk indicates the optic nerve head (ONH). |
Observations made in vivo using the fundus lens are comparable to those made ex vivo. Images were captured in vivo at 10 days post-lesion (DPL), followed by sacrifice the same day to compare imaging results. In vivo images obtained with the fundus lens [A] were compared to the flatmounted retina dissected away from other ocular tissues [B]. Images A and B show ultraviolet (UV)-sensitive cones in the green fluorescent protein (GFP) channel. White box represent corresponding areas between in vivo and ex vivo; the distortion of the boxes seen in vivo is a result of flattening the curvature of the eye for best visualization during dissection. Arrows and chevrons indicate matching clusters of UV cones. Blood vessels were removed during dissection, so are not visible ex vivo. Background fluorescence is due to preservation of the dissected retina in fixative before mounting. |
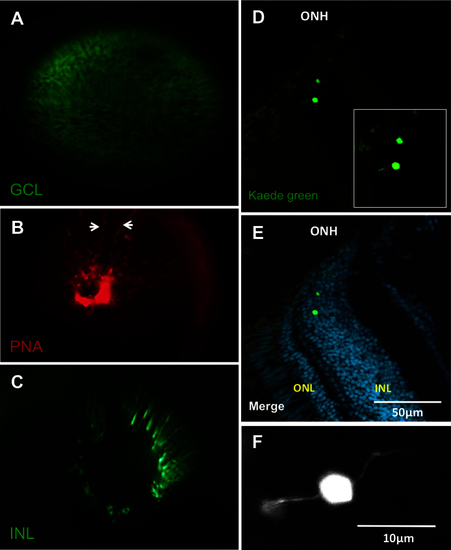
Each of the three nuclear layers viewed under the fundus lens. A: View of a transgenic fish eye with green fluorescent protein (GFP) in the retinal ganglion cells. B: The vessels of the inner eye partially labeled with lectin peanut agglutinin (PNA; arrows indicate edges of a vessel) as an alternative to using the fli1a:EGFP line. C: View of putative bipolar cells of the INL in a fish of the Et(fos:Gal4-VP16)s1181t; Tg(UAS-E1b:Kaede)s1999t line. See Appendix 4 to view this line in vivo. D: Example cryosection of the eye visualized in C, chosen to show bipolar cell morphology near the optic nerve head. E: Same as D, with nuclear stain. The location of the Kaede-labeled cells was confirmed to be the INL, near the ONH. F: Higher magnification view of inset in image D, showing bipolar morphology. Apical and basal extensions to left and right are consistent with bipolar cell morphology. ONH: optic nerve head; ONL: outer nuclear layer; INL: inner nuclear layer. Video of the INL can be found online in Appendix 4. n=3 fish shown. |