
- Title
-
Production of zebrafish offspring from cultured female germline stem cells
- Authors
- Wong, T.T., Tesfamichael, A., and Collodi, P.
- Source
- Full text @ PLoS One
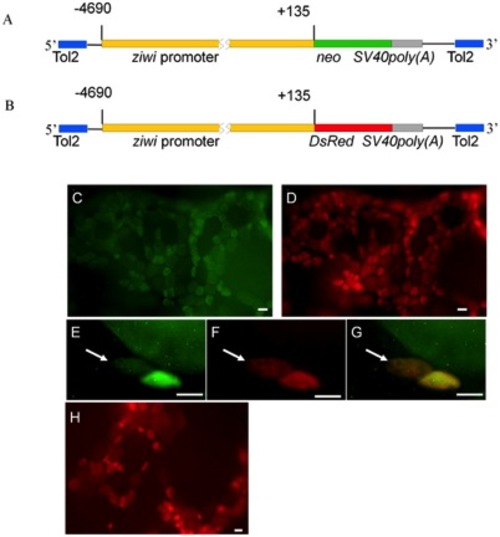
Production of Tg(ziwi:neo) and Tg(ziwi:DsRed) transgenic fish. (A,B) Diagram of the constructs used to produce the Tg(ziwi:neo) and Tg(ziwi:DsRed) transgenic fish. A 4.8 kb fragment of the ziwi promoter [13] was used to drive expression of (A) neo and (B) DsRed. (C) Neo (green) and (D) Vasa (red) are expressed in the same ovarian germ cells of Tg(ziwi:neo). Higher magnification showing expression of (E) Neo (green) and (F) Vasa (red) in the oogonia (white arrows) of Tg(ziwi:neo); (G) merged photo of E and F. (H) DsRed was detected in the ovarian germ cells of Tg(ziwi:DsRed). Scale bar = 50 μm for C, D, H and 20 μm for E, F, G. |
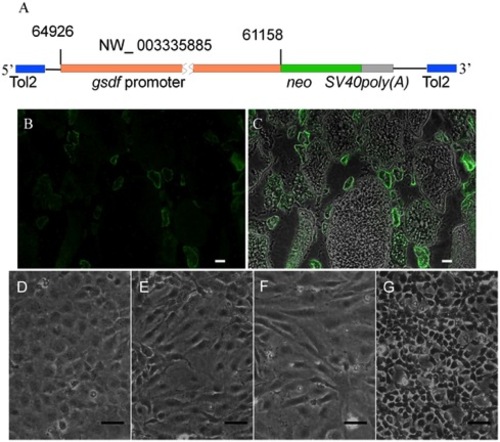
Production of ovarian-somatic feeder cell (OFC) lines. (A) Diagram of the construct used to produce the Tg(gsdf:neo) fish. The plasmid contained a 3.8 kb gsdf promoter controlling expression of neo. (B) Neo (green) expressed in ovarian somatic cells, particularly the granulosa cells, of Tg(gsdf:neo). (C) The merger of (B) with the corresponding bright field photo. Photomicrograph showing 12 month-old (D) OFC1, (E) OFC3, (F) OFC5 and (G) OFC6 ovarian feeder cell cultures. Scale bar = 50 μm. |
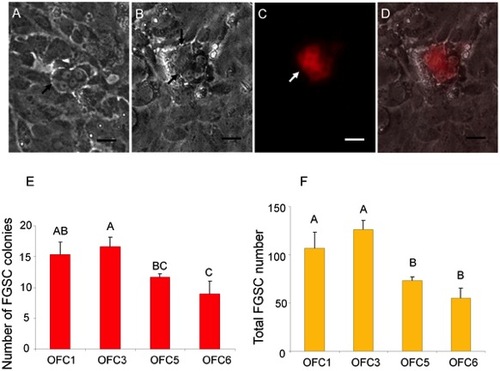
Effect of OFC feeder lines on FGSC cultures. Photomicrograph showing G418-selected FGSCs that were initiated from Tg(ziwi:neo);Tg(ziwi:DsRed) zebrafish and grown on OFC feeders showing a (A) four-cell and (B) eight-cell colonies, black arrows; (C) DsRed expression in the eight-cell colony; (D) merged images of B and C. (E) OFC3 significantly (p = 0.002) promoted FGSC colony formation. (F) Both OFC1 and OFC3 significantly (p = 0.0002) increased the number of FGSCs in a 3-week culture. Data points not sharing a letter (A, B, C) are significantly different by Bonferroni–Dunn tests. Scale bar = 20 μm. |
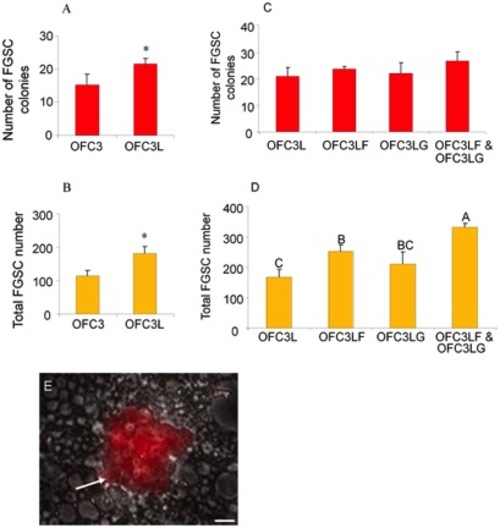
Effect of feeder cells expressing zebrafish Lif, Fgf2 and Gdnf on 3-week FGSC cultures. The presence of feeder cells expressing zebrafish Lif (OFC3L) significantly increased (A) FGSC colony number (p = 0.037) and (B) total FGSC number (p = 0.002) in 3-week cultures (* indicates a significant difference based on Student t test). (C) The presence of feeder cells expressing zebrafish Lif and Fgf2 (OFC3LF) or Lif and Gdnf (OFC3LG) did not significantly increase FGSC colony formation. (D) Addition of feeder cells expressing all 3 zebrafish factors (OFC3LF and OFC3LG) did significantly (p = 0.004) promote FGSC proliferation. (E) Photomicrograph showing a DsRed-positive (white arrow) FGSC colony containing about 28 cells that is growing on OFC3LF and OFC3LG. Data points not sharing a letter (A, B, C) are significantly different by Bonferroni–Dunn tests. Scale bar = 20 μm. |
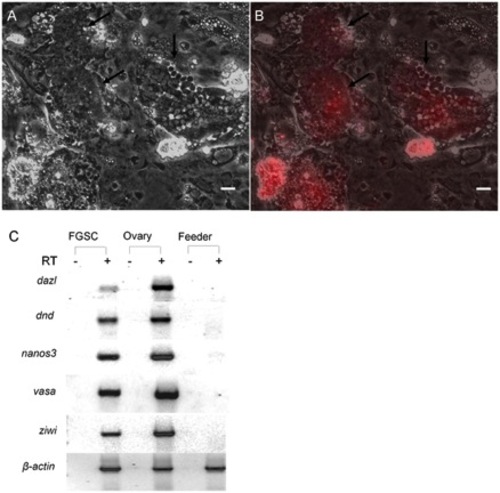
Effect of feeder cells expressing zebrafish Lif, Fgf2 and Gdnf on FGSCs in 6-week cultures. Photomicrographs showing two DsRed-positive FGSC colonies containing 100 or more cells (black arrows) under (A) bright field and (B) merged with UV (DsRed). (C) RT-PCR analysis of RNA isolated from 6-week FGSC cultures showing expression of germ cell specific maker genes, dazl, dnd, nanos3, vasa and ziwi. RT: reverse transcription; Scale bar = 20 μm. |
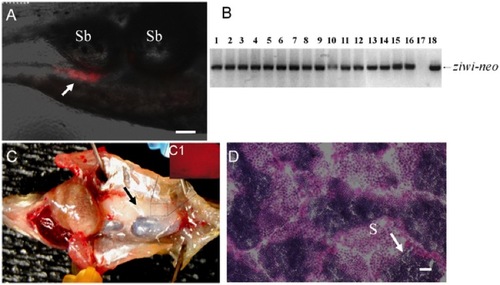
Germline transmission of 6-week cultured FGSCs. (A) Photomicrograph showing the incorporation of DsRed-positive cultured FGSCs (arrow) into the gonad of a recipient larva two weeks after transplantation. (B) Results of genomic PCR showing the presence of ziwi-neo sequences that were inherited by all of the F1 individuals (lanes 1 to 16) produced by a germline chimeric father. Negative control: genomic DNA template from a wild-type larva (lane 17); positive control: pZiwi-neo plasmid DNA template (lane 18). (C) Dissection of a fertile adult male recipient fish showing that the transplanted DsRed-positive FGSCs have proliferated and directed the formation of a testis (arrow) on one side of the body. (C1) Inset shows the gonad under UV light revealing the presence of DsRed-positive cells. (D) Transverse section of testis from a fertile recipient fish showing active spermatogenesis. S: spermatozoa. Scale bar = 50 μm for A, C and 20 μm for D. |