
Image
|
Figure Caption
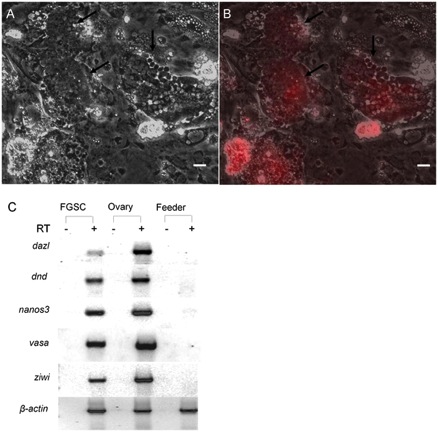
Fig. 5 Effect of feeder cells expressing zebrafish Lif, Fgf2 and Gdnf on FGSCs in 6-week cultures.
Photomicrographs showing two DsRed-positive FGSC colonies containing 100 or more cells (black arrows) under (A) bright field and (B) merged with UV (DsRed). (C) RT-PCR analysis of RNA isolated from 6-week FGSC cultures showing expression of germ cell specific maker genes, dazl, dnd, nanos3, vasa and ziwi. RT: reverse transcription; Scale bar = 20 μm.
Acknowledgments
This image is the copyrighted work of the attributed author or publisher, and
ZFIN has permission only to display this image to its users.
Additional permissions should be obtained from the applicable author or publisher of the image.
Full text @ PLoS One