
- Title
-
Solute carrier family 3 member 2 (Slc3a2) controls yolk syncytial layer (YSL) formation by regulating microtubule networks in the zebrafish embryo
- Authors
- Takesono, A., Moger, J., Faroq, S., Cartwright, E., Dawid, I.B., Wilson, S.W., and Kudoh, T.
- Source
- Full text @ Proc. Natl. Acad. Sci. USA
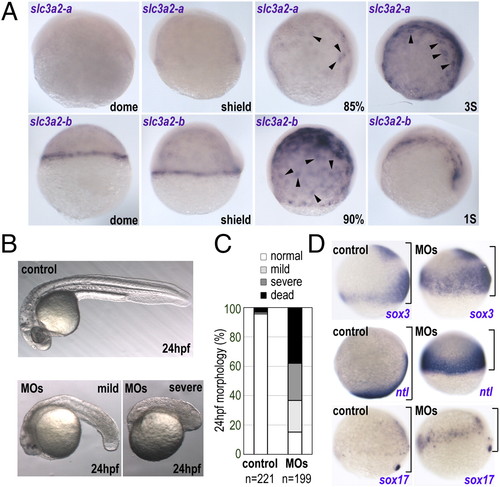
Zebrafish slc3a2 is expressed specifically in the YSL and is essential for embryo development. (A) Expression of zebrafish slc3a2-a and slc3a3-b at different embryonic stages. Intensive slc3a2-a and slc3a2-b expression was observed around the YSN (arrowheads). (B) slc3a2 knockdown (MOs) causes a small head and short body axis at 24 hpf. Shown are examples of mild and severe morphological phenotypes. (C) Morphology at 24 hpf was categorized as normal (white), mild (light gray), or severe (dark gray) phenotypes presenting a small head and short body axis or as dead (black). Data shown are from three experiments; the total number of embryos is shown below each bar. (D) slc3a2 knockdown induces severe epiboly delay. Whole-mount in situ analyses for sox3, no-tail (ntl), and sox17 at the late gastrula stage are shown. The distance between the animal pole and the blastoderm margin is indicated by a black bracket. EXPRESSION / LABELING:
PHENOTYPE:
|
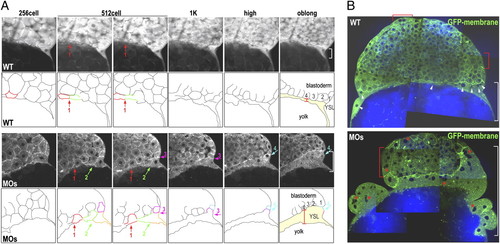
Loss of function of Slc3a2 enhances cell–cell fusion and YSN clustering. (A) Sequences of TPF time-lapse images showing GFP membrane (Upper) and outlines of marginal cells and the YSL (Lower). Fusing cells are indicated by colored outlines, and fusion locations are indicated by colored arrows. The width of the YSL at the outer edge is shown by a white bracket. Cell–cell fusion occurs mostly around the 512-cell stage (red arrow in control, red and green arrows in MOs) but persists through the following stages in slc3a2-MOs (MOs) (pink and cyan arrows in MOs). (B) Merged images of CARS (for lipid; blue) and TPF (for GFP membrane; green) of control and MOs. Uniformly distributed YSN in the control are indicated by white arrowheads, and clustered YSN in MOs are indicated by red asterisks. Multinucleated EVL cells are indicated by red brackets. |
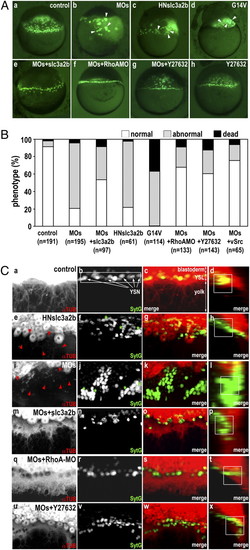
Loss of function of Slc3a2 severely alters YSL organization, which is restored by inhibition of RhoA or ROCK. (A) The YSN are visualized by Sytox green. Shown are lateral views of dome-stage embryos from control (a); slc3a2-MOs (MOs) (b); HN-slc3a2-b (HNslc3a2b) (c); RhoA-G14V (G14V) (d); slc3a2-MOs+slc3a2-b (MOs+slc3a2b) (e); slc3a2-MOs+RhoA-MO (MOs+RhoAMO) (f); slc3a2-MOs + treatment with 50 μM Y-27632 (MOs+Y27632) (g); and control treated with 50 μM Y-27632 (Y27632) (h). Clustered YSN are indicated by white arrowheads. Note rescue of YSL phenotypes by coinjecting slc3a2-b-mRNA and RhoA-MO or by treatment with 50 μM Y-27632. (B) Loss of function of Slc3a2 severely alters YSL organization, which is restored by inhibition of RhoA or ROCK or by overexpression of v-Src. Phenotype in the dome-stage embryo is categorized as normal (white) showing uniform distribution of the YSN without YSL deformation/expansion, abnormal (gray) showing altered YSN localization including uneven distribution of the YSN and YSN clustering with YSL deformation/expansion, or dead (black). Data are from more than three different experiments. Total number of embryos is shown below each bar. (C) Inhibition of RhoA or ROCK restores microtubule networks in the YSL in slc3a2-MOs. (a–d) control; (e–h) HNslc3a2b; (i–l) MOs; (m–p) MOs+slc3a2b; (q–t) MOs + RhoA-MO; (u–x) MOs + Y27632. Microtubule networks were visualized by α-tubulin antibody staining (a, e, i, m, q, and u), and the YSN were visualized by Sytox green (b, f, j, n, r, and v). Shown are merged images of α-tubulin (red) and Sytox green (green) (c, g, k, o, s, and w) and reconstituted section views of the merged images rotated by 90° (d, h, l, p, t, and x). Absence or disruption of microtubule arrays in the YSL is indicated by red arrowheads in e and i, and the clustered YSN are indicated by green asterisks in f and j. Control shows overlap of the YSN and dense YSL microtubule networks (white square in d), which are missing in both HNslc3a2b and MOs (h and l). YSL microtubule networks, YSN distribution, and overlapping of the YSN and YSL microtubules are all restored in MOs+slc3a2b, MOs+RhoA-MO, and MOs+Y27632 (m–p, q–t, and u–x). |
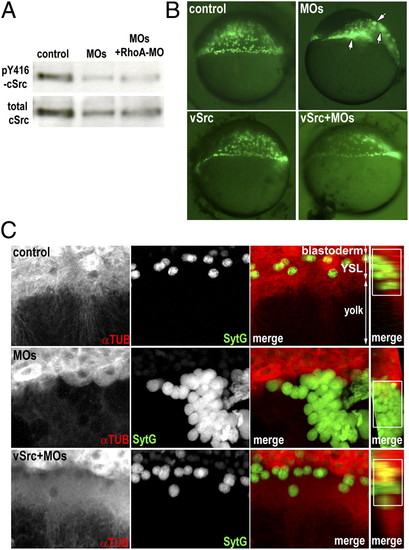
Slc3a2 inhibits the RhoA/ROCK pathway via c-Src activation in regulating YSL organization. (A) slc3a2 knockdown reduces tyrosine phosphorylation of c-Src. Western blot shows pY416 c-Src and total c-Src in lysates from control, slc3a2-morphants (MOs), or slc3a2/RhoA morphants (MOs+RhoA-MO). Data shown are representative of three independent experiments. (B) Overexpression of v-Src restores YSN localization after slc3a2 knockdown. The YSN are visualized by Sytox green. Clustered YSN in MOs (white arrows) are restored by coinjecting v-Src mRNA (v-Src+MOs). (C) Overexpression of v-Src restores microtubule networks in the YSL in slc3a2-knockdown embryos. YSL microtubule networks (αTUB; red), YSN distribution (SytG; green), and overlap of YSN and YSL microtubules (white squares in merged images) are all restored by v-Src+MOs. PHENOTYPE:
|
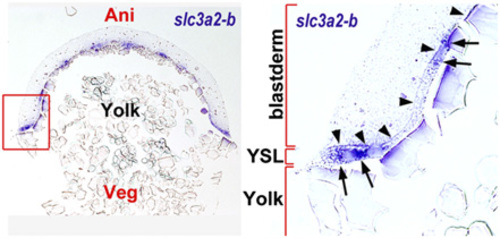
Zebrafish slc3a2 is expressed specifically in the yolk syncytial layer (YSL). Shown is a section of 50% epiboly-stage embryo stained by whole-mount in situ hybridization using the slc3a2-b probe. (Left) Vertical section of the whole embryo. (Right) Enlarged view of the section of the blastoderm rim outlined in the left panel. slc3a2-b expression is restricted at the YSL (arrowheads indicate the border between the blastoderm and the YSL) and accumulates around the yolk syncytial nuclei (YSN) (indicated by arrows). EXPRESSION / LABELING:
|
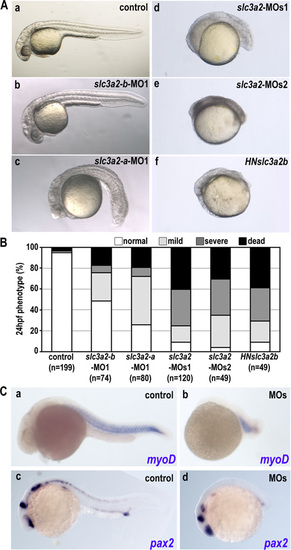
Loss of function of Slc3a2 induces morphological defects but does not affect patterning. (A) Morphological phenotypes caused by slc3a2 knockdown. (a) Control embryo. (b-e) Morphant embryo injected with slc3a2-b-MO1 (b); slc3a2-a-MO1 (c); a combination of slc3a2-a-MO1 and slc3a2-b-MO1 (slc3a2-MOs1) (d); or a combination of slc3a2-a-MO2 and slc3a2-b-MO2 (slc3a2-MOs2) (e). (f) Embryo overexpressing HN-slc3a2-b (HNslc3a2b) (Material and Methods). Single gene knockdown by morpholino causes mild phenotypes (b and c), whereas double knockdown of both slc3a2-a and slc3a2–b by a set of MO1 or MO2 (d and e) or overexpression of HN-slc3a2-b (f) induces severe morphological defects with a smaller head and shorter tail. Images are 1-day-old embryos. (B) Phenotypes at 24 h postfertilization were categorized as normal (white), mild (light gray), severe (small head and short body axis) (dark gray), or dead (black). Representatives of mild and severe phenotypes in morphants are shown in Fig. 1B. Data shown are from three experiments, and the total number of embryos is shown below each bar. (C) Whole-mount in situ analyses for MyoD (a and b) and pax2 (c and d) in control and slc3a2-morphants (MOs). Note that expression patterns of MyoD and pax2 are retained despite severe morphological changes. |