
|
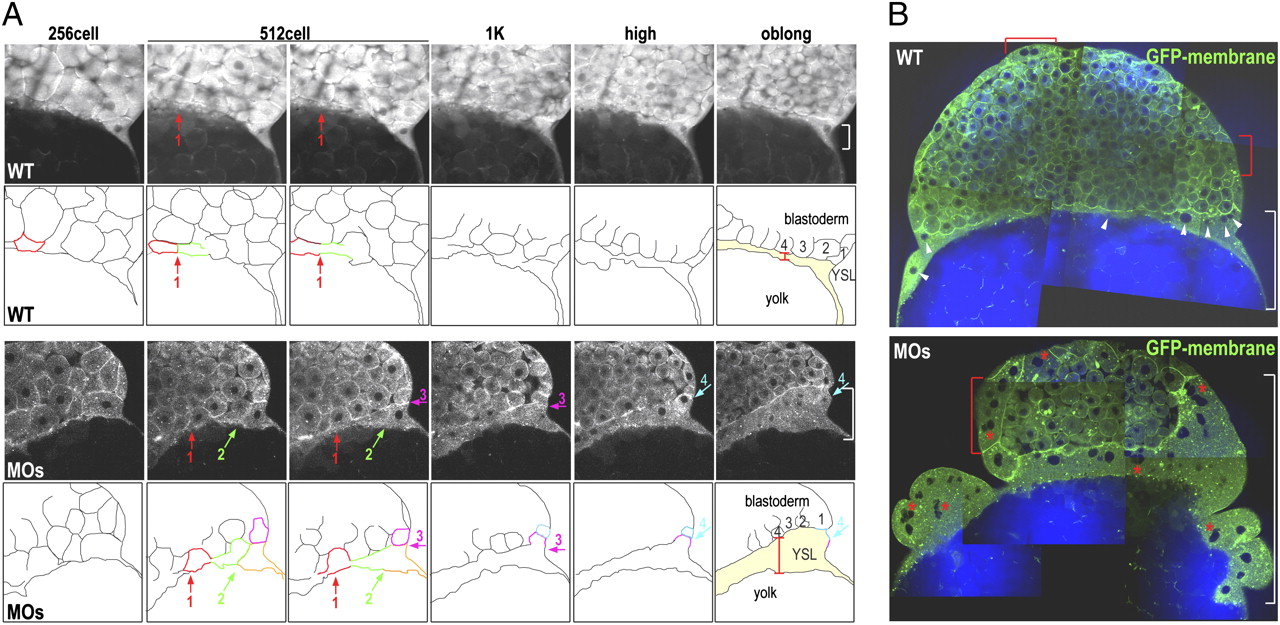
Fig. 2
Loss of function of Slc3a2 enhances cell–cell fusion and YSN clustering. (A) Sequences of TPF time-lapse images showing GFP membrane (Upper) and outlines of marginal cells and the YSL (Lower). Fusing cells are indicated by colored outlines, and fusion locations are indicated by colored arrows. The width of the YSL at the outer edge is shown by a white bracket. Cell–cell fusion occurs mostly around the 512-cell stage (red arrow in control, red and green arrows in MOs) but persists through the following stages in slc3a2-MOs (MOs) (pink and cyan arrows in MOs). (B) Merged images of CARS (for lipid; blue) and TPF (for GFP membrane; green) of control and MOs. Uniformly distributed YSN in the control are indicated by white arrowheads, and clustered YSN in MOs are indicated by red asterisks. Multinucleated EVL cells are indicated by red brackets.