
- Title
-
Transient Knockdown and Overexpression Reveal a Developmental Role for the Zebrafish enosf1b Gene
- Authors
- Finckbeiner, S., Ko, P.J., Carrington, B., Sood, R., Gross, K., Dolnick, B., Sufrin, J., and Liu, P.
- Source
- Full text @ Cell Biosci.
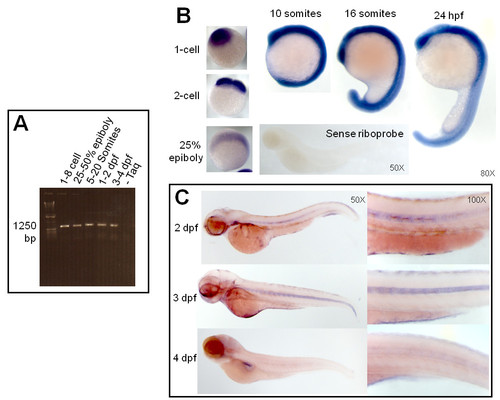
Expression of enosf1b during development. A: enosf1b expression measured by RT-PCR. Primers for full length enosf1b (Table 1) were used to test for the presence or absence of enosf1b in staged embryo lysate. Bp = base pairs. B: Whole mount in situ hybridization (WISH) with sense and antisense DIG-labelled riboprobe during early embryonic development. Negative control for WISH, DIG-labelled sense riboprobe, is free of WISH colored precipitate. C: WISH for enosf1b during later embryonic development. Except for panel C, original magnification for all photomicrographs is in the lower right hand corner of each picture. |
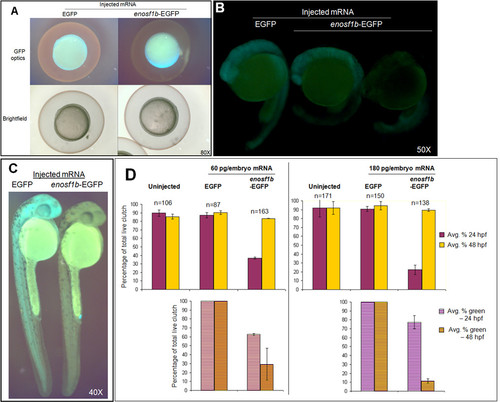
In vivo expression of enosf1b-EGFP compared to EGFP. A-C: Lateral views of representative embryos injected with in vitro transcribed mRNA encoding enosf1b-EGFP or EGFP. Original magnification for all photomicrographs is in the lower right hand corner of each picture. D: Comparison of the effect of injecting equal doses of enosf1b-EGFP or EGFP mRNA on time embryos reach 24 hpf or 48 hpf developmental stage. Data is average of three independent experiments; "n" values are total of the three experiments. Error bars are standard deviation. Original magnification for all photomicrographs is in the lower right hand corner of each picture. |
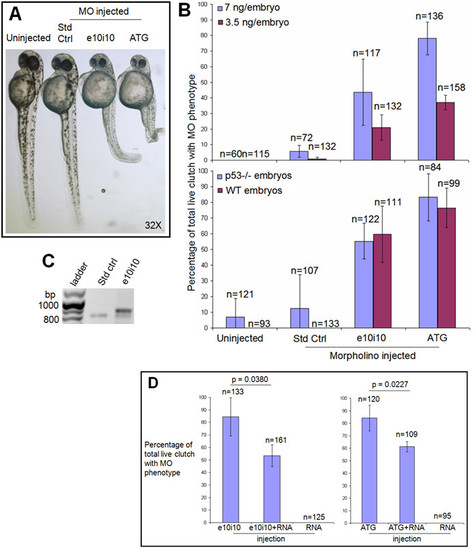
Morpholino (MO) antisense oligonucleotide knockdown of enosf1b expression. A: MO phenotypes. Photomicrograph of uninjected, standard control (Std Ctrl), e10i10, or ATG2 MO-injected embryos at 48 hpf. Original magnification is in the lower right hand corner. B (top panel): Effect of injecting three morpholinos at two different doses compared to uninjected embryos. B (bottom panel): Morpholino phenotypes are not dependent on p53 status. Data in B is average of three independent experiments; "n" values reported are total of the three experiments. Embryos were scored for MO phenotypes at 48 hpf. C: RT-PCR of uninjected, standard control, and e10i10 injected single embryos. Morpholinos were both injected at a final concentration of 7 ng/embryo. Single embryos were collected at 48 hpf and processed through RT-PCR as described in Methods. Bp = base pairs. D (left panel): Rescue of e10i10 phenotype by coinjection of e10i10 morpholino and enosf1b-EGFP mRNA. D (right panel): Titration of ATG2 phenotype by coinjecting ATG2 morpholino and enosf1b-EGFP mRNA. See Methods for MO and RNA doses. Data is average of three independent experiments; "n" values are total of the three experiments. Error bars are standard deviation. Embryos were scored at 48 hpf. Unpaired Student′s t test was used to evaluate statistical significance of observed differences. PHENOTYPE:
|
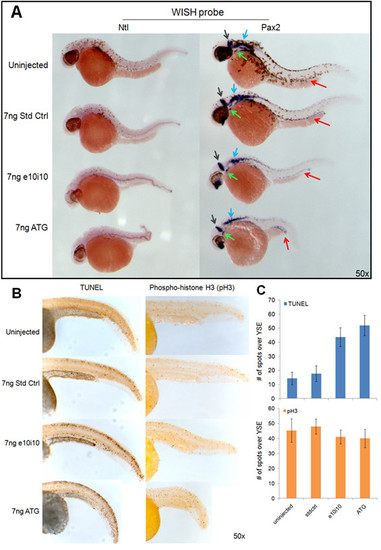
Characterizing the enosf1b knockdown phenotype. A: WISH for no tail and pax2a on 36 hpf morpholino-injected embryos. Red, grey, blue, and green arrows indicate pax2a staining of the pronephros, midbrain-hindbrain boundary, prospective cranial nerves, and thyroid primordium respectively. B (left panel): TUNEL staining on uninjected, std ctrl, e10i10, and ATG2 injected 48 hpf embryos. B (right panel): Mitotic index measured in uninjected, std ctrl, e10i10, and ATG2 injected embryos by antibody staining for phospho-histone H3. C: Morpholino-injected embryos have increased TUNEL staining but unchanged pH3 staining. Data is average of 3 tail counts per condition. Error bars are standard deviation. YSE = yolk sac extension. Original magnification for all photomicrographs is in the lower right hand corner of each picture. |