
|
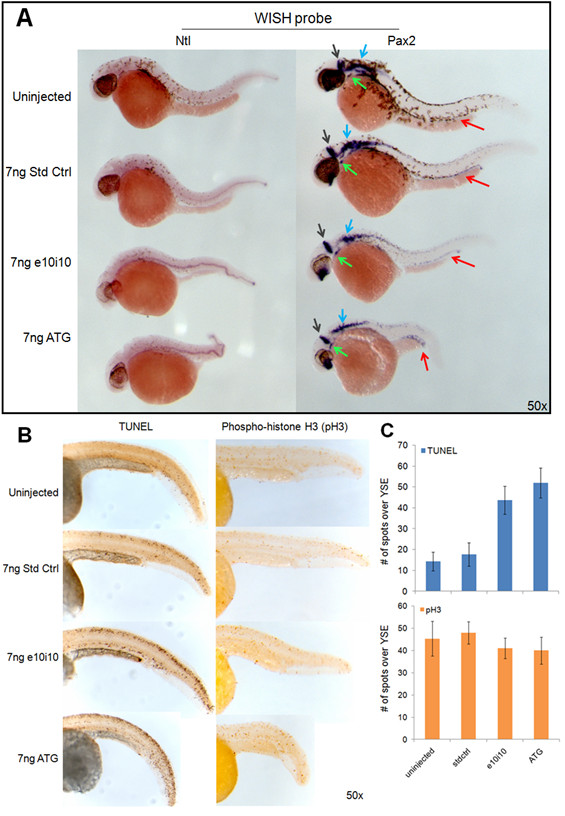
Fig. 6
Characterizing the enosf1b knockdown phenotype. A: WISH for no tail and pax2a on 36 hpf morpholino-injected embryos. Red, grey, blue, and green arrows indicate pax2a staining of the pronephros, midbrain-hindbrain boundary, prospective cranial nerves, and thyroid primordium respectively. B (left panel): TUNEL staining on uninjected, std ctrl, e10i10, and ATG2 injected 48 hpf embryos. B (right panel): Mitotic index measured in uninjected, std ctrl, e10i10, and ATG2 injected embryos by antibody staining for phospho-histone H3. C: Morpholino-injected embryos have increased TUNEL staining but unchanged pH3 staining. Data is average of 3 tail counts per condition. Error bars are standard deviation. YSE = yolk sac extension. Original magnification for all photomicrographs is in the lower right hand corner of each picture.