
Fig. 5
- ID
- ZDB-FIG-111103-5
- Publication
- Finckbeiner et al., 2011 - Transient Knockdown and Overexpression Reveal a Developmental Role for the Zebrafish enosf1b Gene
- Other Figures
- All Figure Page
- Back to All Figure Page
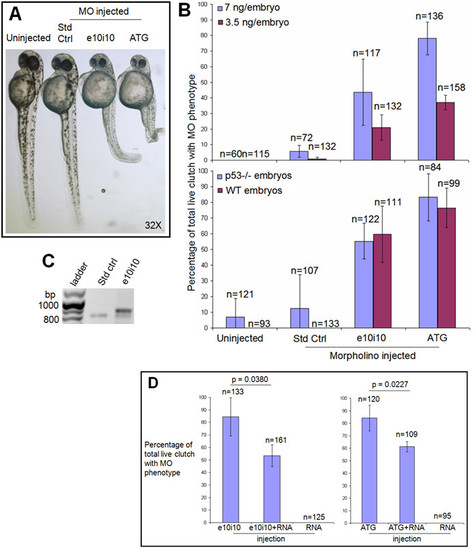
Morpholino (MO) antisense oligonucleotide knockdown of enosf1b expression. A: MO phenotypes. Photomicrograph of uninjected, standard control (Std Ctrl), e10i10, or ATG2 MO-injected embryos at 48 hpf. Original magnification is in the lower right hand corner. B (top panel): Effect of injecting three morpholinos at two different doses compared to uninjected embryos. B (bottom panel): Morpholino phenotypes are not dependent on p53 status. Data in B is average of three independent experiments; "n" values reported are total of the three experiments. Embryos were scored for MO phenotypes at 48 hpf. C: RT-PCR of uninjected, standard control, and e10i10 injected single embryos. Morpholinos were both injected at a final concentration of 7 ng/embryo. Single embryos were collected at 48 hpf and processed through RT-PCR as described in Methods. Bp = base pairs. D (left panel): Rescue of e10i10 phenotype by coinjection of e10i10 morpholino and enosf1b-EGFP mRNA. D (right panel): Titration of ATG2 phenotype by coinjecting ATG2 morpholino and enosf1b-EGFP mRNA. See Methods for MO and RNA doses. Data is average of three independent experiments; "n" values are total of the three experiments. Error bars are standard deviation. Embryos were scored at 48 hpf. Unpaired Student′s t test was used to evaluate statistical significance of observed differences. |
| Fish: | |
|---|---|
| Knockdown Reagents: | |
| Observed In: | |
| Stage: | Long-pec |