
- Title
-
A Slit/miR-218/Robo regulatory loop is required during heart tube formation in zebrafish
- Authors
- Fish, J.E., Wythe, J.D., Xiao, T., Bruneau, B.G., Stainier, D.Y., Srivastava, D., and Woo, S.
- Source
- Full text @ Development
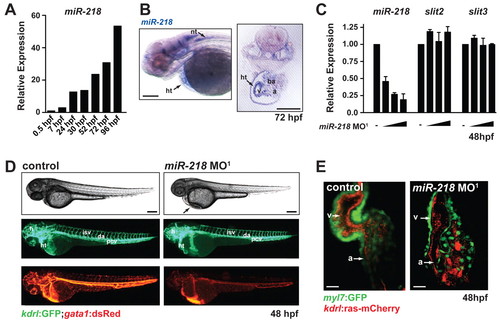
miR-218 regulates heart formation and function. (A) Expression of miR-218 (relative to 0.5 hpf timepoint) was monitored by real-time qRT-PCR during zebrafish development. (B) In situ analysis of miR-218 expression at 72 hpf reveals expression in the heart and neuronal tissue. (C) Expression of miR-218, slit2 and slit3 were quantified by real-time qRT-PCR in miR-218 morphants (2.5, 5 and 10 ng of miR-218 MO1) at 48 hpf. Data are mean + s.e.m. (D) Control and miR-218 morphants were assessed at 48 hpf by live imaging of embryos. Phase-contrast images (top) demonstrate pericardial edema in the miR-218 morphant (arrow). Fluorescent images of the same embryos show labeling of endothelial/endocardial cells in Tg(kdrl:GFP) (middle) and labeling of blood cells in Tg(gata1:dsRed) (bottom). Vascular patterning appears normal in miR-218 morphants, but circulation is reduced. (E) Cardiac morphology at 48 hpf was assessed by confocal microscopy (ventral view). Tg(myl7:GFP) expression labels the myocytes and Tg(kdrl:ras-mCherry) labels the endocardium. miR-218 morphant hearts contain myocytes and endocardium but exhibit severe morphological defects. ht, heart; nt, neural tube; a, atrium; v, ventricle; ba, branchial arches; h, head; isv, intersomitic vessel; da, dorsal aorta; pcv, posterior cardinal vein. Scale bars: 100 μm in B,D; 25 μm in E. EXPRESSION / LABELING:
PHENOTYPE:
|
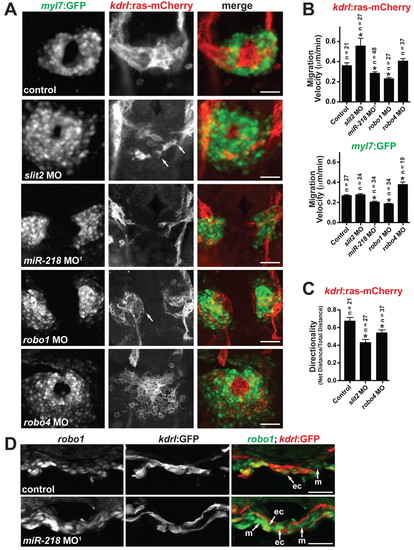
Slit/Robo signaling regulates heart tube formation. (A) Early heart field migration defects in zebrafish morphants: slit2, miR-218, robo1 and robo4. Shown is Tg(kdrl:ras-mCherry);Tg(myl7:GFP) expression at 20 somites. Dorsal views, anterior to the top. slit2 morphants have disrupted endocardial migration, including loss of sheet-like migration and endocardial cells have multiple filopodial protrusions (arrows). miR-218 and robo1 morphants have delayed migration of the endocardium and myocardium. The endocardial cells of robo1 morphants display a rounded phenotype (arrow). Migration of the heart fields is not delayed in robo4 morphants, but the morphology of the endocardial and myocardial cells is altered compared with controls. (B) Migration velocities of endocardial [Tg(kdrl:ras-mCherry) expression] and myocardial [Tg(myl7:GFP) expression] cells were quantified from time-lapse images. The number of cells tracked is shown above each bar. slit2 morphants have enhanced endocardial migration rates, whereas miR-218 and robo1 have reduced endocardial and myocardial migration rates. *, P<0.05 compared with control. (C) Directionality of migration was assessed by quantifying the ratio of the net distance traveled to the total distance traveled. A decrease in the ratio indicates an increase in the randomness of migration. slit2 and robo4 morphants have defects in directional migration. *, P<0.05 compared with control. Data in B and C are mean + s.e.m. (D) In situ analysis of robo1 expression at the 20-somite stage reveals an increase in expression in miR-218 morphants. Transverse sections, dorsal to the top. ec, endocardium; m, myocardium. Scale bars: 50 μm in A and D. EXPRESSION / LABELING:
PHENOTYPE:
|
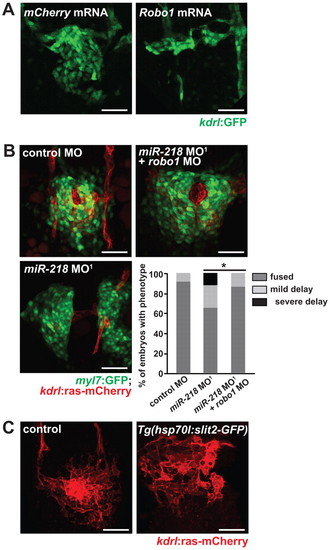
Heart field migration is sensitive to Robo1 dosage. (A) Endocardial migration was defective at 20 somites in zebrafish embryos injected with 75 pg Robo1 mRNA (mCherry mRNA was utilized as a control). (B) Rescue of migration defects in miR-218 morphants was accomplished by co-injecting sub-phenotypic doses of robo1 MO. Quantification of migration defects is shown beneath. *, P<0.05 (Fisher′s exact test for a 2×3 contingency table). (C) Analysis of endocardial migration at the 20-somite stage in Tg(hsp70l:slit2-GFP) embryos that were heat shocked at 5 somites. Embryos lacking the transgene were used as a control. Disorganization of the endocardium was evident in Slit2-overexpressing embryos. Scale bars: 50 μm. EXPRESSION / LABELING:
PHENOTYPE:
|
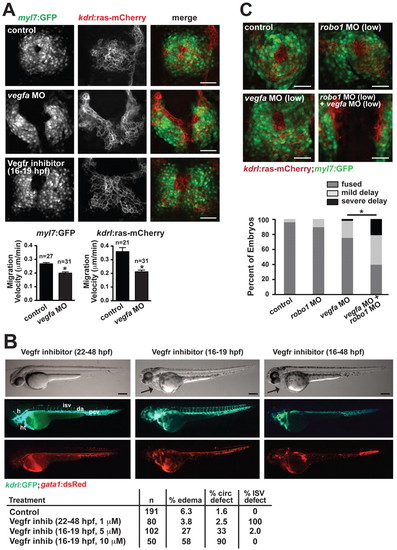
Vegf regulates the migration of the endocardium/myocardium towards the midline. (A) Defects in heart field migration in zebrafish vegfa morphants and embryos treated with Vegfr inhibitor (10 μM Vatalanib at 14-20 somites,16-19 hpf). Quantification of migration velocity of the myocardium [Tg(myl7:GFP) expression] and endocardium [Tg(kdrl:ras-mCherry) expression] in vegfa morphants is indicated beneath. *, P<0.05 compared with control. Data are mean + s.e.m. (B) The patterning of the intersomitic vessels (ISVs) and the head vasculature is severely disrupted by inhibiting Vegfr after heart field migration has occurred (1 μM Vatalanib at 22-48 hpf, left panels), but pericardial edema does not occur and blood flow through the dorsal aorta and posterior cardinal vein is robust. By contrast, edema (arrow) and circulation defects occur when Vegfr is inhibited during heart field migration (10 μM Vatalanib at 16-19 hpf, middle panels), despite the normal patterning of the vessels after removal of the drug at 19 hpf. Continued inhibition of Vegfr (10 μM Vatalanib from 16-48 hpf, right panels) results in profound edema (arrow), which appears to result from severe vascular defects, including a fused dorsal aorta/posterior cardinal vein. Quantification of circulation phenotypes is shown beneath. A circulation defect was defined as reduced blood flow in the axial vessels. (C) Genetic interaction between vegfa and robo1 was assessed by use of sub-phenotypic levels of vegfa and robo1 MOs. The combination of these MOs resulted in profound migration defects observable at the 20-somite stage. Quantification of phenotypes is shown beneath. Mild delay was defined as the contralateral heart fields contacting at the posterior end but remaining unfused anteriorly. Severe delay was defined as a complete absence of heart field fusion at the midline. *, P<0.05 (Fisher′s exact test for a 2×3 contingency table). h, head; ht, heart; isv, intersomitic vessel; da, dorsal aorta; pcv, posterior cardinal vein. Scale bars: 50 μm in A,C; 100 μm in B. EXPRESSION / LABELING:
PHENOTYPE:
|
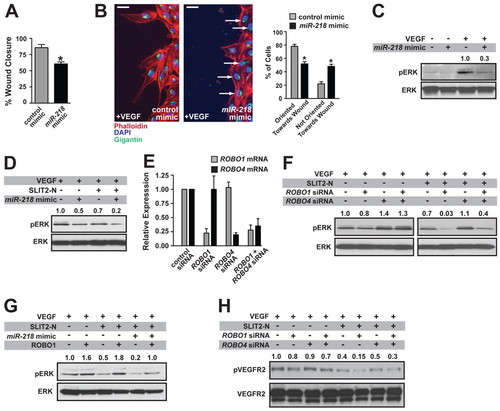
miR-218 regulates the response of endothelial cells to VEGF through the regulation of Slit/Robo signaling. (A) HUVEC transfected with miR-218 mimic have reduced VEGF-stimulated migration in a scratch wound assay. Measurements were taken 16 hours after scratch wounding. *, P<0.05 compared with control mimic. (B) Polarity, assessed by the arrangement of the Golgi apparatus (visualized by Gigantin staining, green) in relation to the scratch surface, was visualized and quantified, demonstrating polarity defects in miR-218 mimic-transfected cells. Cells were scored as either polarized (Gigantin staining less than 45° from scratch face) or non-polarized (arrows) towards the wound edge. *, P<0.05 compared with control mimic. Scale bars: 25 μm. (C) Defective MAP kinase signaling in VEGF-treated HUVEC transfected with miR-218 mimic as determined by blotting for phospho-ERK. Densitometric quantification is shown above the lanes, with the VEGF-treated control sample being set to 1.0. Densitometric values were normalized to that of the loading control. (D) Pretreatment of cells with SLIT2-N resulted in increased inhibition of MAP kinase pathway activity in miR-218-transfected cells. (E) Real-time qRT-PCR confirmed knockdown in ROBO1 and ROBO4 in siRNA-transfected cells. (F) Defective VEGF-dependent MAP kinase signaling in HUVEC transfected with ROBO1 siRNA, enhanced MAP kinase signaling with ROBO4 siRNA, and partial rescue of ROBO1 siRNA defects with ROBO4 siRNA, in the presence or absence of SLIT2-N. The left and right panels are from the same blot, with identical exposures. (G) Rescue of the MAP kinase signaling defect by overexpression of ROBO1 in miR-218 mimic-transfected cells. (H) Defects in VEGF-dependent phospho-VEGFR2 in ROBO1 siRNA-transfected cells. Data in A, B and E are mean + s.e.m. |
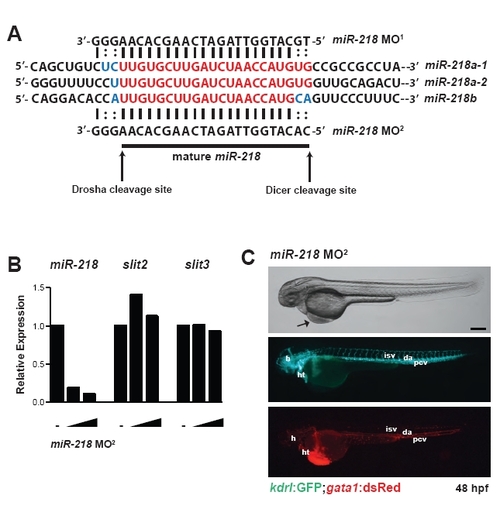
miR-218 knockdown in zebrafish. (A) Schematic indicating a portion of the precursor sequences of the three miR-218 genes in zebrafish (miR-218a-1, miR-218a-2 and miR-218b). Sequences overlapping the region targeted by miR-218 MO1 and miR-218 MO2 that differ among miR-218 genes are indicated in blue. The location of the mature microRNA is indicated beneath and is also indicated in red. The Drosha cleavage site, which is targeted by the miR-218 MOs is indicated by an arrow, as is the Dicer cleavage site. Watson-Crick base-pairing is indicated by vertical lines, and colons indicate base-pairing that is not Watson-Crick for all of the miR-218 isoforms. (B) Knockdown of miR-218 was quantified by real-time qRT-PCR in control embryos or embryos injected with 5 or 10 ng of miR-218 MO2. Expression of slit2 and slit3 was also monitored by real-time qRT-PCR. (C) The phenotype of embryos injected with miR-218 MO2 is shown. miR-218 morphants have edema and circulation defects and minor vascular defects. Scale bar: 100 μm. |
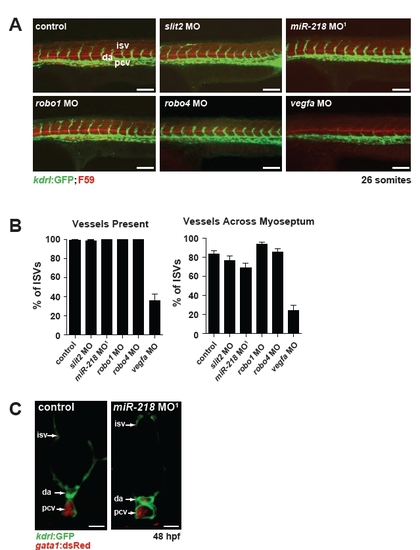
Slit/Robo signaling does not appear to affect vessel sprouting and miR-218 does not control vascular integrity. (A) Images of the sprouting of the intersomitic vessels (isv) in morphants by confocal microscopy. Tg(kdrl:GFP) labels the endothelial cells. The somite boundaries are indicated by F59 staining (red). vegfa morphants had severe sprouting defects, but sprouting appeared unaffected in other morphants. Scale bar: 100 μm. (B) Sprouting phenotypes were quantified by determining the percentage of the intersomitic vessels that were present and the percentage of intersomitic vessels that crossed the myoseptum. The total numbers of embryos analyzed were as follows: control, n=29; slit2 MO, n=19; miR-218 MO1, n=14; robo1 MO, n=13; robo4 MO, n=17; vegfa MO, n=20. Data are mean + s.e.m. (C) Vascular integrity was assessed by confocal microscopy of transverse Vibratome sections of embryos at 48 hpf. The axial vasculature was lumenized in miR-218 morphants as determined by the presence of gata1:dsRed+ erythrocytes within the axial vessels. Scale bar: 25 μm. |
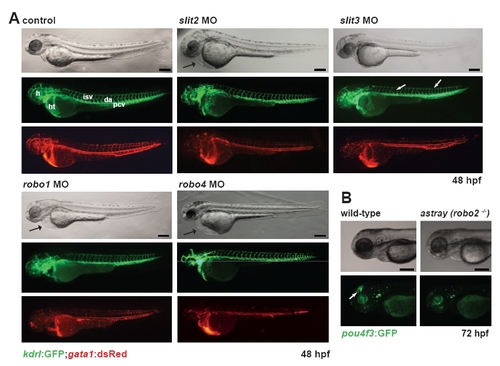
Phenotypic analyses of Slit/Robo morphants or mutants. (A) Phenotypic analysis of slit2, slit3, robo1 and robo4 morphants at 48 hpf. slit2, robo1 and robo4 morphants displayed circulation defects (gata1:dsRed) but normal vascular patterning (kdrl:GFP). Pericardial edema is indicated by a black arrow. slit3 knockdown results in defects in the intersomitic vessels and dorsal longitudinal anastomotic vessels, including broken or missing vessels (white arrows); however, pericardial edema does not occur in slit3 morphants. Whereas circulation is defective in the intersomitic vessels and dorsal longitudinal anastomotic vessels, circulation appears normal in the axial vessels. h, head; ht, heart; da, dorsal aorta; pcv, posterior cardinal vein; isv, intersomitic vessel; dlav, dorsal longitudinal anastomotic vessel. (B) robo2-/- (astray) mutants do not have obvious circulation defects or edema at 72 hpf. The pou4f3:GFP transgene marks the retinal ganglion cell axons (arrow), the migration of which is defective in astray mutants. Scale bars: 100 μm. |
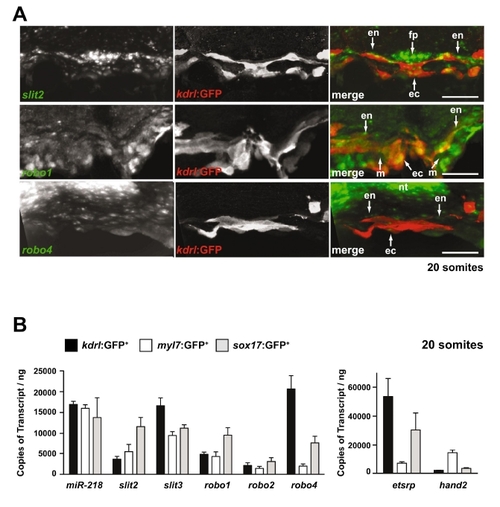
Expression of Slit/Robo components during heart field migration. (A) Expression of slit2, robo1 and robo4 was determined by fluorescent in situ hybridization of 20-somite stage embryos. Shown are transverse sections, dorsal to the top. slit2, robo1 or robo4 are indicated in green in the merged images, whereas Tg(kdrl:GFP), which marks the endocardium, is indicated in red in the merged images. slit2 appears to be expressed in the floor plate of the neural tube, in the endoderm and also in the endocardium. robo1 appears to be expressed in the endoderm, myocardium and the endocardium, whereas robo4 appears to be expressed in the dorsal neural tube and at low levels in the endocardium. fp, floor plate; ec, endocardium; en, endoderm; nt, neural tube; m, myocardium. Scale bar: 50 μm. (B) Expression profile of miR-218, slit2, slit3, robo1, robo2 and robo4 in sorted cells from the indicated transgenic zebrafish lines at 18-20 somites. kdrl:GFP labels the endothelial/endocardium, myl7:GFP labels the myocytes and sox17:GFP labels the endoderm. etsrp (etv2) and hand2 were used as positive controls of endothelial/endocardial and myocardial lineages, respectively. The mean ± s.e.m. of three independent experiments is shown. |
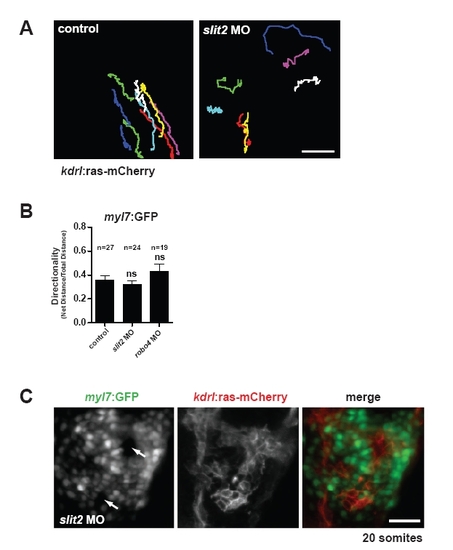
Characterization of migration defects in slit2 morphants. (A) Migration tracks of individual kdrl:ras-mCherry-expressing endocardial cells in uninjected control embryos or slit2 morphants. Scale bar: 25 μm. (B) Myocardial directionality was quantified in uninjected controls and slit2 and robo4 morphants. No significant differences in directionality were noted. ns, not statistically significant. Data are mean + s.e.m. (C) Example of multiple lumens that form in slit2 morphants (arrows). Scale bar: 50 μm. |