
- Title
-
Loss of Cofilin 1 Disturbs Actin Dynamics, Adhesion between Enveloping and Deep Cell Layers and Cell Movements during Gastrulation in Zebrafish
- Authors
- Lin, C.W., Yen, S.T., Chang, H.T., Chen, S.J., Lai, S.L., Liu, Y.C., Chan, T.H., Liao, W.L., and Lee, S.J.
- Source
- Full text @ PLoS One
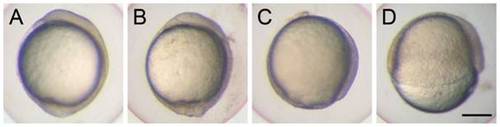
Knockdown of cfl1 causes epiboly defects. Embryos were injected with or without cfl1 MO and photographed at 10 h post-fertilization (hpf). The cfl1 MO caused epiboly defects of different severities. (A) A sham-injected embryo reached 100% epiboly. (B) A cfl1 morphant with a malformed tail bud. (C) A cfl1 morphant that reached 90% epiboly. (D) A cfl1 morphant that reached 50% epiboly. Scale bar, 200 μm. PHENOTYPE:
|
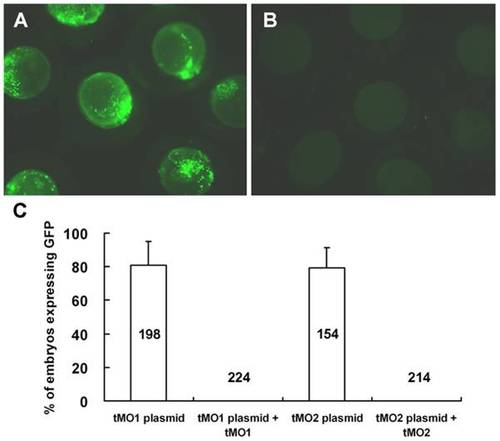
Cfl1 MOs efficiently block the translation of GFP fusion constructs containing respective MO binding site. Embryos at 1-cell stage were injected with 330 pg pCS2+ XLT fused with a fragment of cfl1 gene sequence from -22 to +195 or -52 to +51 in the absence or presence of 7.5 ng cfl1 tMO1 or tMO2, respectively. The expression of GFP was examined at 10 hpf and photographed under epifluorescent microscopy. The representative photos for embryos treated without cfl1 MO (A) and with tMO1 (B) are shown and the percentages of injected embryos expressing GFP are shown in average ± standard deviation (C). |
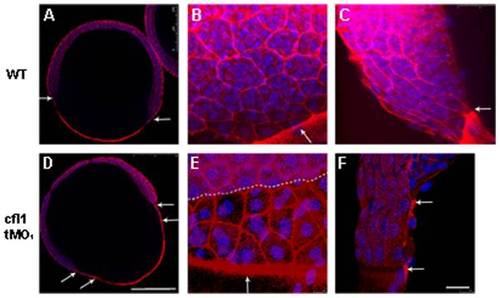
Knockdown of cfl1 enhances the filamentous actin (F-actin) formation and attenuates adhesion between the EVL and the DEL. Embryos at the 65%~70% epiboly stage were fixed, stained with rhodamine phalloidin and DAPI to reveal F-actin and nuclei, respectively, under confocal microscopy. Confocal images of whole-embryo sections at a lower magnification are shown for untreated (A) and cfl1 tMO1-injected embryos (B). In the untreated embryo (A), an arrow indicates synchronous leading edges of EVL and DEL whereas distinctly separated leading edges are obvious as pointed by arrows in cfl1 tMO1-injected embryos (B). At a higher magnification (B, C, E, F), F-actin was more condensed at the boundaries of blastomeres and the margin of blastoderm (arrows) of cfl1 morphants (E) compared to untreated embryos (B). The progression of the EVL margin (arrow) was more advanced than that of DEL (dashed line) in cfl1 morphants (E) compared to that of untreated embryos (B). From the side view (C, F), the EVL margin (upper arrow) was clearly advanced 2 cells ahead of DEL (lower arrow) in cfl1 morphants (F) that was not seen in untreated embryos (C). Scale bars: 25 μm for A and D; 250 μm for B, C, E, F. PHENOTYPE:
|
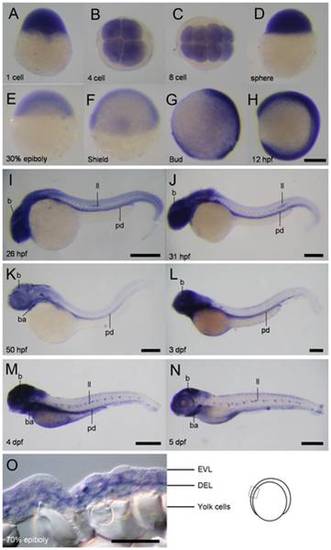
Spatial and temporal expression of cfl1 during embryogenesis. (A-N) Representative whole-mount in situ hybridization photographs are shown to reveal the expression patterns of cfl1 at the designated stages from 1-cell to 5 day post-fertilization (dpf) as denoted at the lower left corner of each panel. (O) A representative cryo-section photograph of an embryo at the 70% epiboly stage underwent WISH against cfl1. The cryo-section was taken from the box region as depicted in the embryo carton shown on the right. b, brain; ba, bronchial arches; ll, lateral line system; pd, pronephric duct; pa, pharyngeal arches; EVL, enveloping layer; DEL, deep cell layer. Scale bars: 400 μm for the 4- and 5-dpf embryos, 200 μm for the others and 50 μm for the cryo-section photograph. |
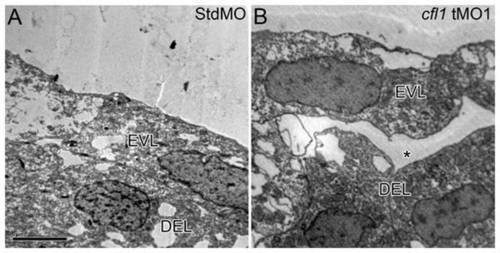
Loss of Cfl1 causes disruption of the attachment between the EVL and DEL. Embryos injected with either the StdMO (A) or cfl1 tMO1 (B) were fixed at 8.5 hpf and subjected to transmission electron microscopy. Cohesive attachment between the EVL and DEL on lateral sites of embryos was observed in StdMO-treated control embryos, but a cleft (aster) was observed in cfl1 morphants. Each photograph is representative of at least five embryos with similar results. PHENOTYPE:
|
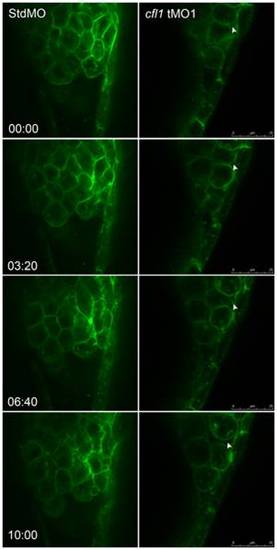
Live cell imaging reveals loose cell-cell interactions between the DEL and EVL in cfl1 morphants. Embryos injected with designated MOs and membrane-bound green fluorescent protein (GFP) mRNA, were dechorionated, immobilized, and examined by confocal microscopy for 10-min recordings at 10-s intervals per frame. The snapshots of representative embryos from the StdMO- (left column) or cfl1MO-injected embryos (right column) are shown. The recording times in minutes are denoted in the lower left corner of the left column. While StdMO-treated embryos showed continuous tight attachments between the DEL and EVL, DEL cells in cfl1 morphants did not form a tight connection with the EVL, which was further evidenced by the more-rounded cell shapes. Arrowheads indicate spaces between the EVL and DEL. A single-cell-thick EVL is to the right; yolk cells are toward the left; the animal pore is on the top; and the vegetal pore is at the bottom. PHENOTYPE:
|
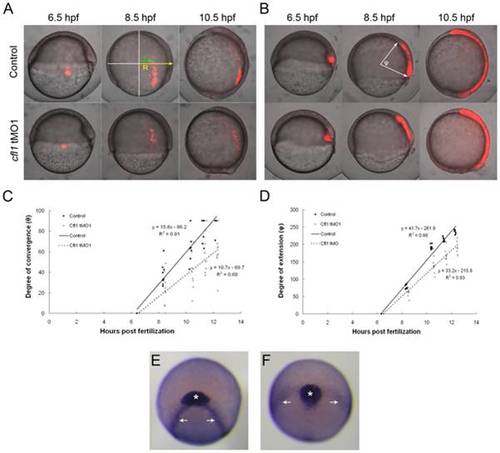
Knockdown of cfl1 causes convergent and extension defects. (A, B) Embryos were injected with Q-rhodamine with or without cfl1 tMO1 and incubated in the dark. Cells of the lateral (A) and dorsal blastomere margins (B) are marked as shown in red fluorescence at the shield stage and observed until 10.5 hpf. Representative photographs taken at 6.5, 8.5 and 10.5 hpf for both the untreated control and cfl1 MO-injected embryos are shown. (C) As shown in the panel A with an 8.5-hpf control embryo, the radius of the embryo (R) and the migration distance of the labeled cells (r) were measured. The degree of convergence (θ) was calculated by applying the following equation: θ = sin-1(r/R), and then plotted against the stage of the embryo in hpf. (D) As shown in panel B with an 8.5-hpf control embryo, the angle (φ) between the two arrows of the anterior and posterior ends of the marked axial mesoendoderm connecting the center of the embryo was measured in each embryo to estimate the degree of extension. The degree of extension (φ) was then plotted against the stage of the embryo. (E, F) WISH against cstl1b (expressed in the prechordal plate as indicated by asterisks) and dlx3b (expressed in paraxial mesoderm as indicated by arrows) of bud-stage zebrafish embryos was performed. Representative photographs in frontal view are shown for an untreated (E) and a cfl1 tMO1-injected embryo (F). |
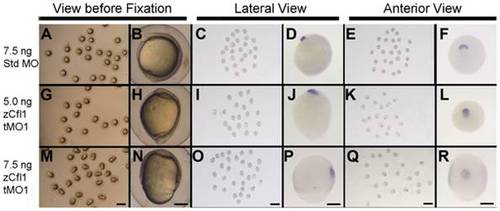
Knockdown of cfl1 does not affect involution of mesendoderm. Embryos injected with 7.5 ng Std MO (A–F), 5.0 ng (G–L) or 7.5 ng cfl1 tMO1 (M–R) were examined at 10 hpf (A, B, G, H, M, N), fixed and subjected to WISH against cstl1b (C–F, I–L, O–R). Representative photographs were taken at a lower (6.3X) or higher (50X) magnification and scale bars are shown at the bottom panel of each column (1 mm for 6.3X and 200 μm for 50X). |
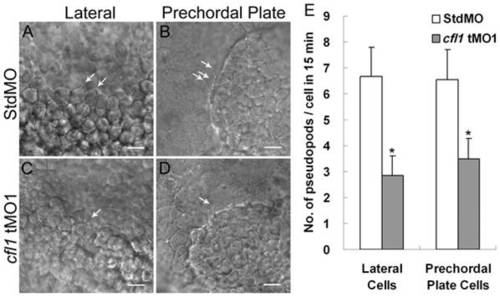
Knockdown of cfl1 inhibits the pseudopod formation of involuting cells. Embryos injected with MOs were dechorionated, immobilized, monitored, and recorded in 15-min continuous time-lapse movies. Lateral cells were monitored from the lateral side (A, C), and prechordal plate cells were monitored from the anterior side (B, D). Representative photographs are shown for each group as designated. Arrows indicate the sites of pseudopods. (E) Number of pseudopods was counted and analyzed for each group. Both lateral cells and prechordal plate cells in cfl1 morphant embryos had significantly fewer pseudopods (* p<0.05). Only upper error bars of the standard deviations are shown. PHENOTYPE:
|
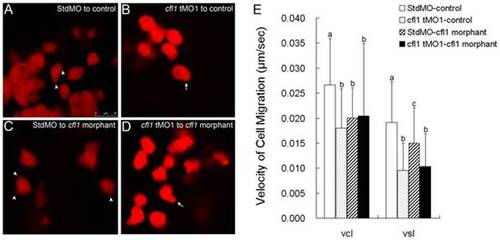
Cfl1 is required cell-autonomously for proper epiboly cell migration. Labeled cells from donor embryos injected with rhodamine-dextran in combined with StdMO (A, C) or cfl1 tMO1 (B, D) were transplanted into control embryos (A, B) and cfl1 morphants (C, D) respectively, and recorded under a confocal microscope. Pseudopods (arrowheads) and polygonal cell shape were observed in StdMO-injected cells transplanted in both control hosts (A) and cfl1 morphants (C), while blebbing-like structure (arrows) and rounded cell shape were observed in cfl1 tMO1-injected cells transplanted in both control hosts (B) and cfl1 morphants (D). The photographs shown are representative of at least 10 embryos in each experiment. Migration curvilinear velocity (Vcl) and straight line velocity (Vsl) of these StdMO- and cfl1 tMO1-injected cells in control hosts or cfl1 morphants were recorded by time-lapse epifluorescent microscopy and analyzed by SimplePCI software, respectively (E). Values between groups were compared using unpaired Student′s t-test, and those showing a significant (* p<0.05) difference are denoted by different letters. |
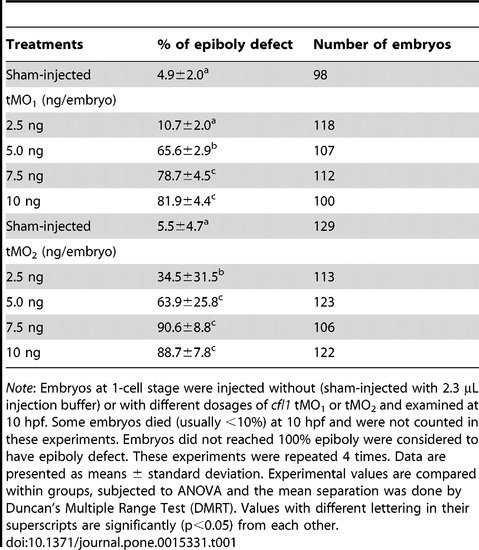
Loss of Cfl1 dose-dependently causes epiboly defect. PHENOTYPE:
|