
- Title
-
Kita Driven Expression of Oncogenic HRAS Leads to Early Onset and Highly Penetrant Melanoma in Zebrafish
- Authors
- Santoriello, C., Gennaro, E., Anelli, V., Distel, M., Kelly, A., Köster, R.W., Hurlstone, A., and Mione, M.
- Source
- Full text @ PLoS One

Expression of oncogenic HRAS driven by kita promoter induces hyperpigmentation in larvae. a) A 3dpf wild-type zebrafish; b) a kita-GFP-RAS hyperpigmented transgenic with displaced melanocytes (red arrows). A′-b′) size and shape of representative head melanocytes in control (a′) and kita-GFP-RAS embryos (b′) c–e) Dorsal views of the head of control (c) and kita-GPF-RAS larvae (d). The red outline in (c) indicates the ROI where counts were made. e) Quantification of the number of melanocytes (mean±SD) (mean±SD, ***p<0.001) as indicated. f–h) Dorsal views of the lower body of control (f) and kita-GPF-RAS larvae (g). h) Quantification of the number of melanocytes (mean±SD, ***p<0.001) as indicated. i–k) GFP marked melanocytes (green) and BrdU immunostaining (red) in kita-GFP (i) and kita-GFP-RAS (j) 4dpf zebrafish. Calibration bar: 20 μm. k) Percentage of BrdU+ melanocytes in control (GFP) and melanoma line (Ras) at 4dpf (mean±SD, n = 5). l–n) Dorsal views of heads of kita-GFP-Ras larvae raised in DMSO (l), in U0126 (m) or in PD98059 (n) in the presence of epinephrine. o) WB analysis performed 3dpf GFP (control larvae) and RAS (kita-GFP-RAS larvae) revealed an activation of P-ERK. p–q) Treatment with UO126 (UO) or PD98059 (PD) caused a reduction of P-ERK. Calibration bars: 50 μm for a, b, c–f, l–n; 20 μm for i–j. EXPRESSION / LABELING:
PHENOTYPE:
|
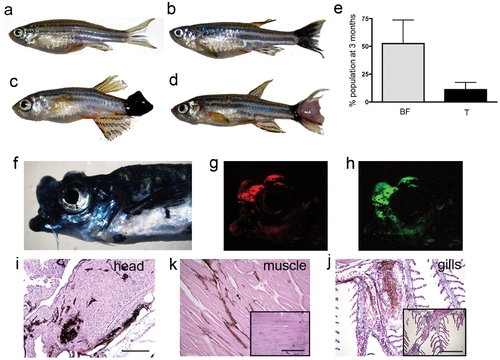
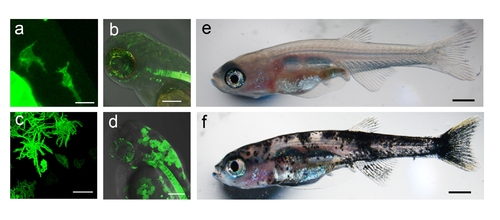
kita-GFP-RAS fish develop melanoma. a–d) Different phenotypes in three-month old kita-GFP-RAS zebrafish: a) control fish; b) black caudal fin; c) large hyper-pigmented tumor; d) hypo-pigmented tumor. e) Percentage of the progeny of kita-GFP-RAS fish incross displaying a black fin phenotype (BF) or tumor (T) at 3 months (mean±SD). f) Lateral view of a fish bearing an infiltrating melanoma of the mouth and head, which also expresses mCherry (g) and GFP-RASV12 (h). H&E staining of parraffin sections of the fish in f) that display infiltrations of melanocytes in the head (i), muscles (k), gills (j). Insets are from control animals. Calibration bars for i–j = 100 μm. |
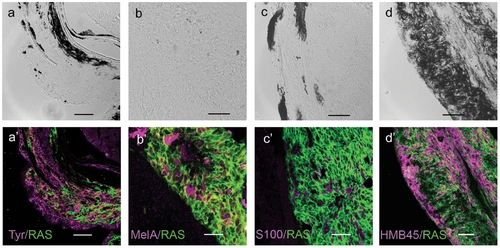
Immunostaining of zebrafish melanoma cryostat sections. In the lower panels (a′–d′) immunostainings (magenta) for the markers indicated in the lower right corners of each micrograph. All cells express GFP-RAS (green at the plasma membrane). Upper panels (a–d) show the DIC image of each sample, which consisted mostly of unpigmented tumors. Calibration bars = 50 μm. EXPRESSION / LABELING:
|
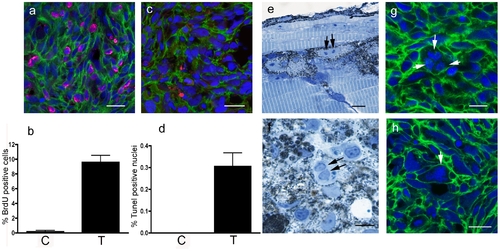
Histology of kita-GFP-Ras melanoma. a) BrdU+ nuclei (magenta) in a section of a melanoma developing in a 3-month-old kita-GFP-RAS fish. b) Diagram showing percentage of BrdU+ cells in control skin (C) and melanoma (T) sections (n = 5). c) TUNEL+ nuclei (red) in a cryostat section of a melanoma developing in a 3-month-old kita-GFP-RAS fish. d) Diagram showing percentage of TUNEL+ cells in control skin (C) and melanoma (T) sections (n = 5). e) Semithin (0.5 μm thick) resin section of a 5dpf kita-GFP-RAS larva, showing several melanocytes, one of which is at the end of mitosis. Arrows point to the two chromosomal condensations. f) Semithin section of a tumor from a 3-month-old kita-GFP-RAS fish showing enrichment in melanocytes one of which is binucleate (arrows). g–h) Cryostat sections of melanomas developing in kita-GFP-RAS 3-month-old fish. All cells express GFP-RAS (green at the plasma membrane) and have DAPI (blue) counterstained nuclei. Arrows point to a multipolar spindle (g) and a polyploid giant nucleus with condensed chromosomes (h). Calibration bars: 50 μm. PHENOTYPE:
|
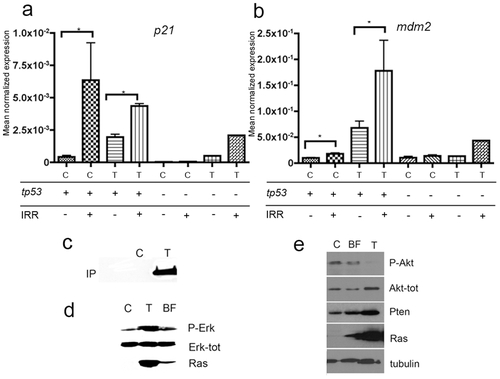
kita-GFP-Ras tumors have a robust p53 pathway activation. a–b) QPCR analysis of tp53 target gene expression. p21(a) and mdm2 (b) mRNA expression in control (C) or tumors from kita-GFP-RAS transgenic fish (T) with a wild-type (tp53+) or mutant (tp53 -) background genotype, as indicated. Samples were subjected to X-ray irradiation (IRR +) or left unirradiated (IRR -). All data are expressed as Mean Normalized Expression and were normalized to the expression levels of β-actin as an endogenous control. Error bars indicate s.d. except for tp53-/-, for which the error bars indicate range. n = 3 for C tp53+, IRR-; n = 3 for C tp53+, IRR+; n = 9 for T tp53+, IRR-; n = 3 for tp53+, IRR+; n = 2 for C tp53- IRR-; n = 2 for C tp53- IRR+; n = 1 for T tp53- IRR-; n = 1 for T tp53- IRR+. c-e) RAS pathway activation in tumor. c) Protein extracts from control and fin with tumor show active ras (Ras-GTP, immunoprecipitated with Raf1). Western Blot analysis of protein extracts prepared from control (C), fin with tumor (T) and black fin (BF) show an increased phosphorylation of ERK1/2 (d) and increased amounts of total AKT, but not phospho-AKT, which correlates with an increase in PTEN levels (e). EXPRESSION / LABELING:
|
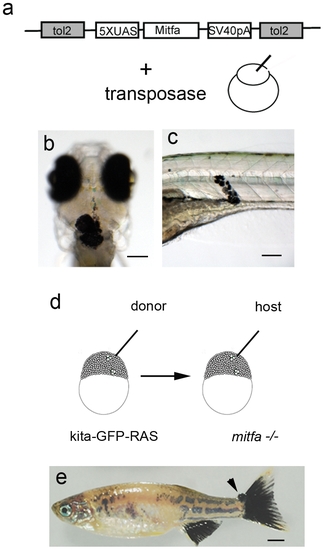
Melanoma development is dependent on mitfa expression. a) Schematic diagram of the construct and injection strategy used to re-express mitfa in mitfa-/- (nacre); kita-GFP-RAS zebrafish. Transformed melanocytes in the head of a 30hpf (b) and in the trunk of 5dpf (c) mitfa-/- (nacre); kita-GFP-RAS injected larvae. d) Schematic representation of the transplantion strategy, where cells were transplanted from kita-GFP-RAS embryos into mitfa-/- (nacre) embryos at approximately 1000 cell stage. e) Picture of 4 month-old trasplanted mitfa-/- (nacre) fish displaying a patchy recovered pigment pattern and a small tumor at the level of the caudal fin (arrow). Calibration bars = 100 μm for b,c; 2 mm for e. |
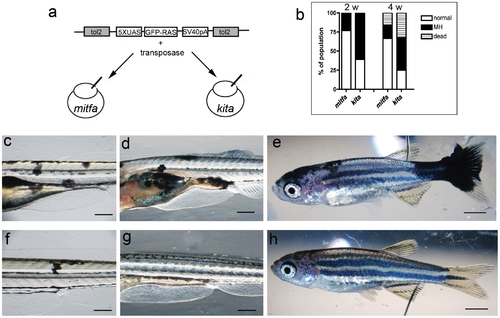
Comparison between mitfa and kita Gal4 driver lines. a) Schematic diagram of the construct and injection strategy used to transiently express GFP-HRASV12 in the mitfa:Gal4 and kita:Gal4 lines. b) Percentage of injected fish that display melanoytic hyperplasia/melanoma (MH) at 2 and 4 weeks (w) post fertilization. c–e) 4, 14 and 32dpf kita-Gal4 fish injected with UAS-GFP-HRASV12 plasmid for somatic integration. Mosaic expression of the transgene leads to abnormal melanocytes (c), persistent melanocytic hyperplasia (d) and melanoma (e) f–h) 4, 14 and 32dpf mitfa-Gal4 fish injected with UAS-GFP-HRASV12 plasmid. Mosaic expression of the transgene in this driver line generates fewer and smaller melanocytic lesions. Calibration bars = 2 mm. |
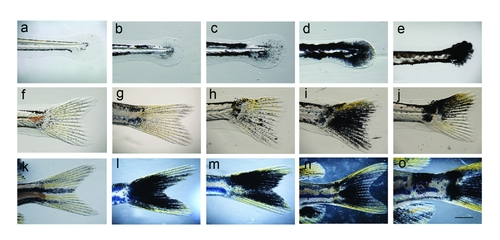
Range of caudal fin phenotypes in kita-GFP-RAS juvenile fish. a, f, k) control fish (kita-GFP line). b–e, g–j, l–o) kita-GFP-RAS line. a–e) 15 dpf; f–k)18–22 dpf (pre-metamorphosis); j–o) 21–28 dpf (postmetamorphosis). Tumors are present in e, j, o. Calibration bar = 1mm. |
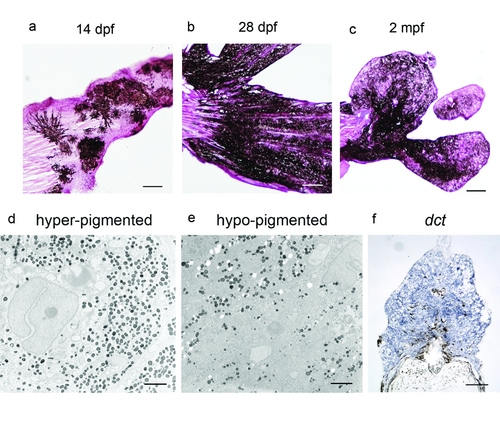
Histology of melanoma. a–c) H&E staining of representative tail regions of kita-GFP-RAS fish at the ages indicated. d–e) Representative electromicrographs of a hyperpigmented (d) and a hypopigmented (e) melanoma. f) in situ hybridization for dopachromo tautomerasis (dct) in a cryostat section of a tail hypopigmented melanoma from a 1 month old transgenic zebrafish. Calibration bars = 100 μm for a,b,c,f; 0.5 mm for d and e. |
Expression of kita-HRASV12 in mitfa-/- (nacre) background is unable to rescue melanocyte survival. a) Migratory neural crest are the only cells expressing GFP-HRAS in 3 dpf kita-GFP-RAS embryos in a nacre background (b). Compare with fully differentiated, transformed tail melanocytes (c) in a 3 dpf kita-GFP-RAS embryo in a AB background (d). e) 21 dpf nacre x kita-GFP-RAS fish is devoid of melanocytes, as opposed to AB x kita-GFP-RAS fish (f), which has increased pigmentation. Calibration bar 100 mm for a–d; 2 mm for e–f. |
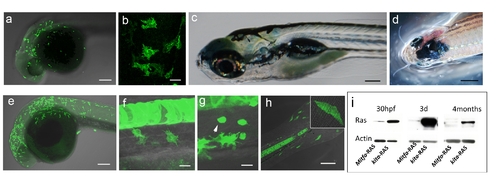
Similarities and differences between mitfa-GFP-RAS and kita-GFP-RAS transgenic lines. a–b, e–f) Similar expression pattern, but different number of GFP-RAS migrating melanocyte progenitors at 32 hpf in mitfa-GFP (a,b) and kita-GFP (e,f) double transgenic zebrafish. c) Normal pigmentation in a 5 dpf mitfa-GFP-RAS larva. d) The only melanoma that developed in mitfa-GFP-RAS fish by three months of age (n = 25). g–h) Other cell types expressing GFP under the kita promoter. Melanocytes and mucous cells (arrows) in kita-GFP 3dpf larvae (g). Flat epithelial cells (enlarged in inset), present in the fins of kita-GFP 3 dpf larvae (k). These cells do not change in number or size upon expression of HRAS. i). Western Blot analysis of protein extracts from double transgenic fish at the age indicated in the upper lane. Increased levels of Ras in kita:GFP-RAS versus mita:GFP-RAS fish. Calibration bars: 50 μm in a–b;e–n; 2 mm in c–d. |