
Fig. 1
- ID
- ZDB-IMAGE-101223-13
- Genes
- Antibodies
- Publication
- Santoriello et al., 2010 - Kita Driven Expression of Oncogenic HRAS Leads to Early Onset and Highly Penetrant Melanoma in Zebrafish
- All Figures
- Figures for Santoriello et al., 2010
|
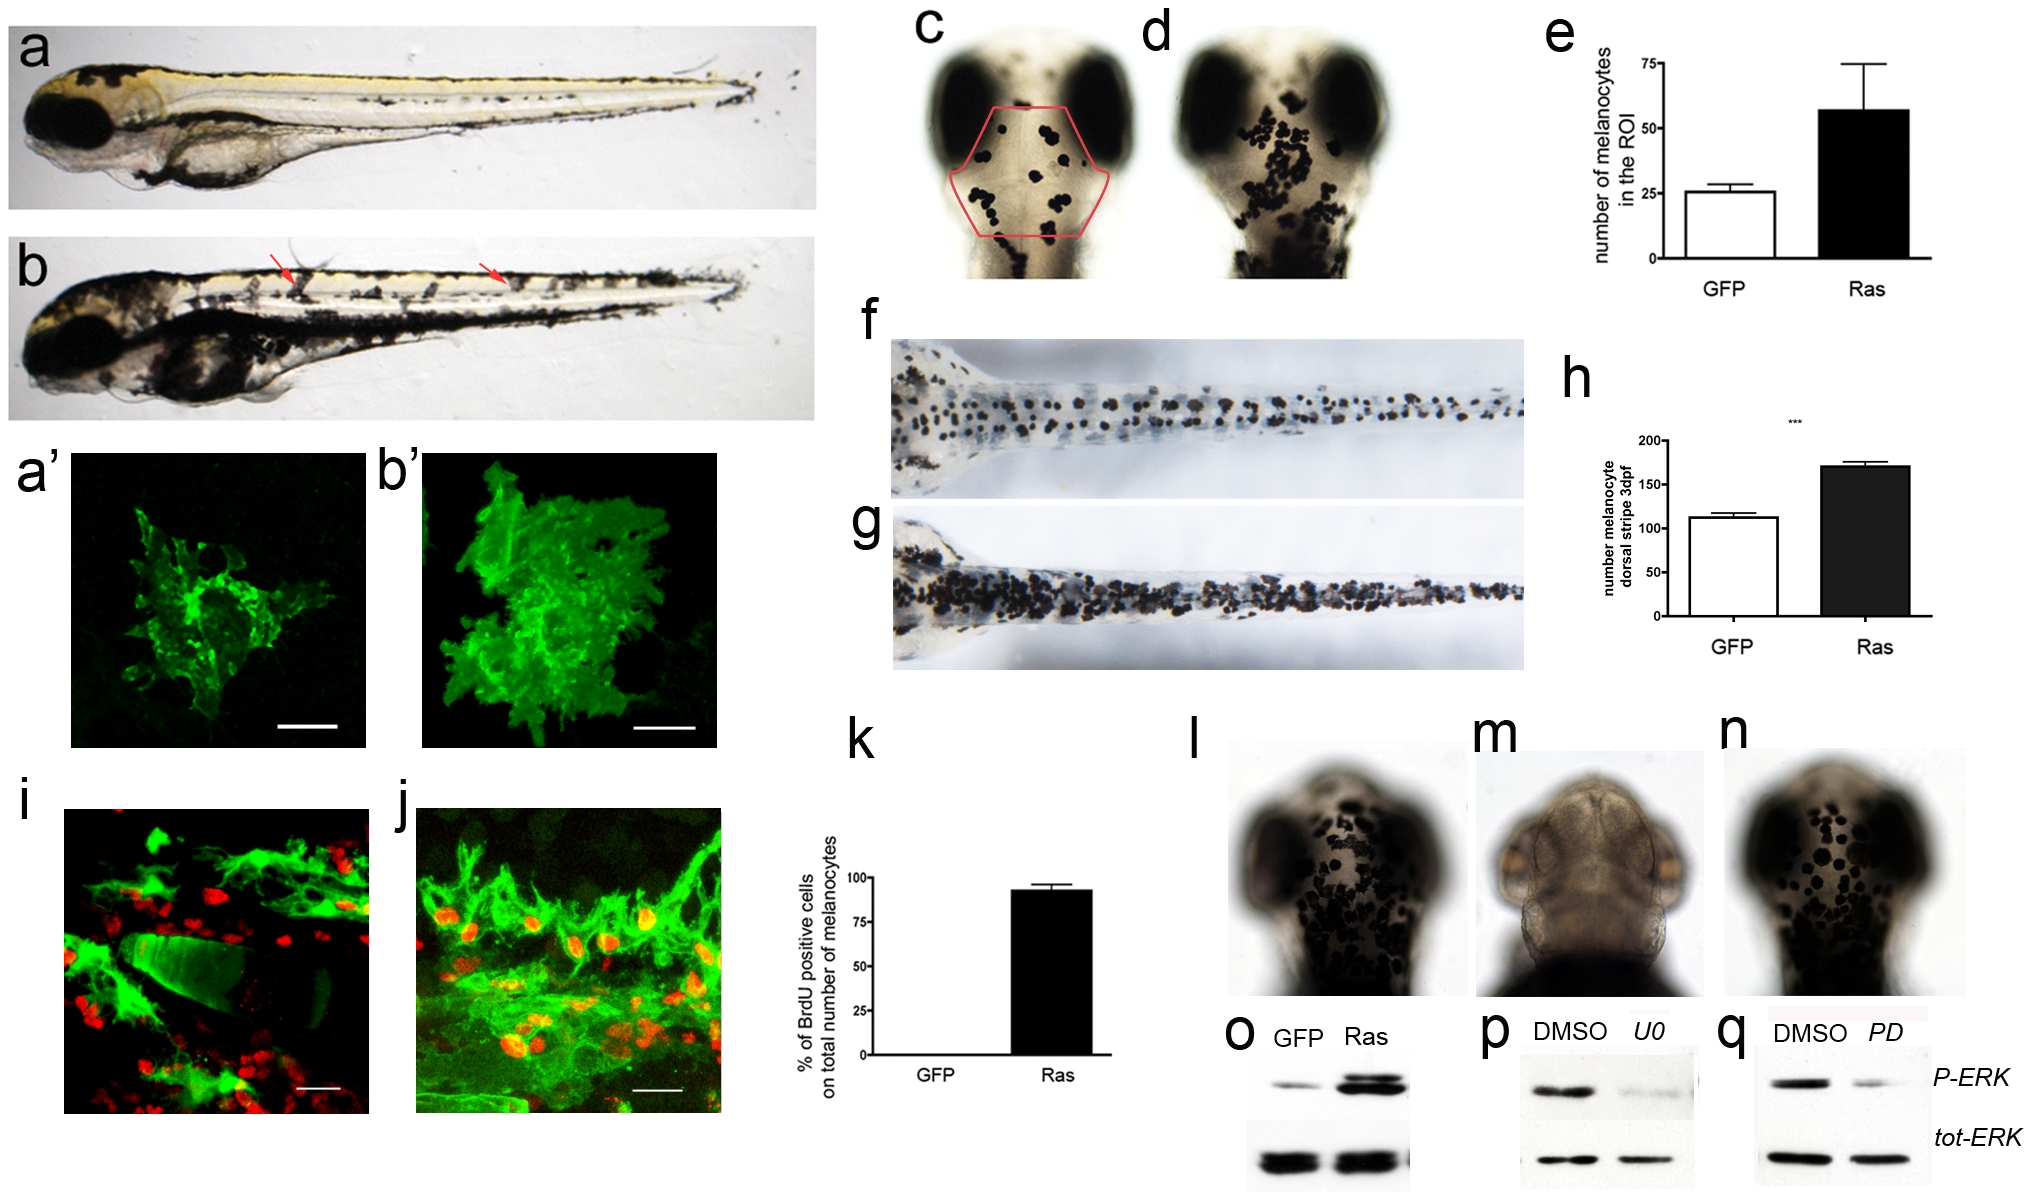
Fig. 1 Expression of oncogenic HRAS driven by kita promoter induces hyperpigmentation in larvae.
a) A 3dpf wild-type zebrafish; b) a kita-GFP-RAS hyperpigmented transgenic with displaced melanocytes (red arrows). A′-b′) size and shape of representative head melanocytes in control (a′) and kita-GFP-RAS embryos (b′) c–e) Dorsal views of the head of control (c) and kita-GPF-RAS larvae (d). The red outline in (c) indicates the ROI where counts were made. e) Quantification of the number of melanocytes (mean±SD) (mean±SD, ***p<0.001) as indicated. f–h) Dorsal views of the lower body of control (f) and kita-GPF-RAS larvae (g). h) Quantification of the number of melanocytes (mean±SD, ***p<0.001) as indicated. i–k) GFP marked melanocytes (green) and BrdU immunostaining (red) in kita-GFP (i) and kita-GFP-RAS (j) 4dpf zebrafish. Calibration bar: 20 μm. k) Percentage of BrdU+ melanocytes in control (GFP) and melanoma line (Ras) at 4dpf (mean±SD, n = 5). l–n) Dorsal views of heads of kita-GFP-Ras larvae raised in DMSO (l), in U0126 (m) or in PD98059 (n) in the presence of epinephrine. o) WB analysis performed 3dpf GFP (control larvae) and RAS (kita-GFP-RAS larvae) revealed an activation of P-ERK. p–q) Treatment with UO126 (UO) or PD98059 (PD) caused a reduction of P-ERK. Calibration bars: 50 μm for a, b, c–f, l–n; 20 μm for i–j.