
- Title
-
Distinct functions for ERK1 and ERK2 in cell migration processes during zebrafish gastrulation
- Authors
- Krens, S.F., He, S., Lamers, G.E., Meijer, A.H., Bakkers, J., Schmidt, T., Spaink, H.P., and Snaar-Jagalska, B.E.
- Source
- Full text @ Dev. Biol.
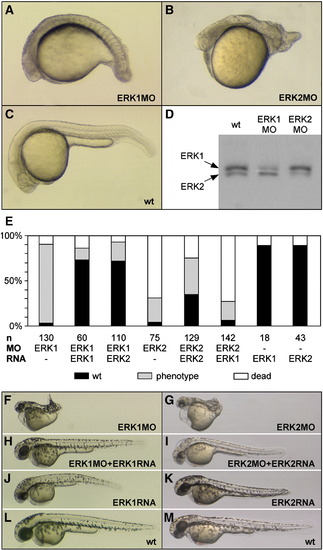
Specific ERK1 and ERK2 knockdown by morpholino injection. (A–C) Images show representative examples of the ERK1 (A) or ERK2 (B) knockdown phenotypes at 24 hpf, compared to wild type (wt) embryos (C). (D) Specific knockdown was confirmed by Western blot analysis optimized to discriminate between the sizes of ERK1 (p44MAPK) and ERK2 (p42MAPK) protein and detected with global ERK antibody (D). Protein samples were isolated from 20 hpf embryos, injected with 0.2 mM ERK1MO or ERK1MO. (E) Statistics of ERK knockdown and (cross-) rescue experiments determined by co-injection of ERK1 or ERK2 morpholino with synthetic erk1 or erk2 mRNA at 24 hpf. Black = wild type; gray = phenotype; white = dead. (F–M) Images show phenotypes of surviving knockdown embryos at 48 hpf (F, G), embryos rescued by co-injection of corresponding mRNA (8pg erk1 RNA, 1.5pg erk2 RNA) (H, I), embryos injected with mRNA only (J, K) and wild type embryos at 48 hpf (L, M). EXPRESSION / LABELING:
|
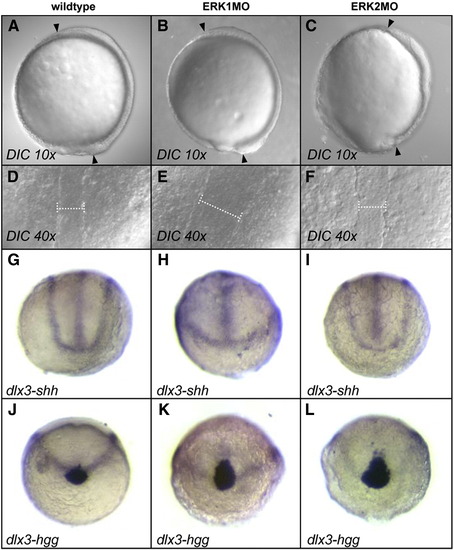
Phenotypic characterization of ERK1 and ERK2 morphants in late-gastrulation and early segmentation indicates affected cell migration in CE movements. (A, D, G, J); wild type control embryos, (B, E, H, K); ERK1 knockdown embryos, injected with 0.2 mM ERK1MO, (C, F, I, L); ERK2 knockdown embryos, injected with 0.2 mM ERK2MO. (A–C); Live embryos at yolk plug closure (YPC) to tailbud (TB) stages, animal pole is up, dorsal to right in wild type, ERK1MO or ERK1MO injected embryos, The distance between the arrowheads resembles the length of the AP body axis (Zeiss EC Plan-Neofluar 10x/0.30 objective), or dorsal view (D–F), white spacer highlights the widening of the dorsal notochord (Zeiss Plan-Neofluar 40x/0.75 ∞/0.17 objective). (G–L); Combined in situ hybridization on 10-hpf old embryos with dlx3 (edge neural plate) with shh (midline) or with hgg1 (hatching gland) marker genes (anterior view, dorsal to top). |
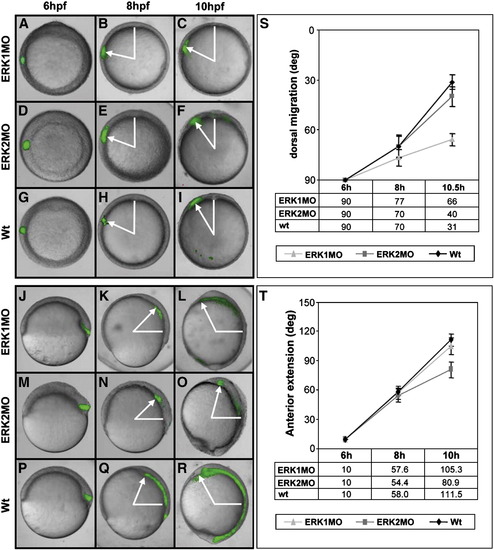
ERK1 and ERK2 are differentially involved in CE cell movements. Embryos were injected with MO and caged fluorescein dextran, which was activated at shield stage (6 hpf) laterally to determine dorsal migration (A–I; animal pole view, dorsal to top) and dorsally to determine anterior extension (J–R; lateral view, dorsal to right). Images show uncaging cells directly after activation (A, D, G, J, M, P), at 8 hpf (B, E, H, K, N, Q) and at 10 hpf (C, F, I, L, O, R). Cell-tracing experiments were performed in ERK1MO injected (A–C, J–L), ERK2MO injected (D–F, M–O) and wild type embryos (G–I, P–R). (S) Quantification of dorsal migration (n = 10), measured as indicated with white arrows (A–I) as degrees from dorsal. (T) Quantification of anterior migration measured as indicated with white arrows (J–R) as degrees of anterior movement (n = 10). ERK1MO: gray triangle, ERK2MO: dark gray square, wild type: black diamond. PHENOTYPE:
|
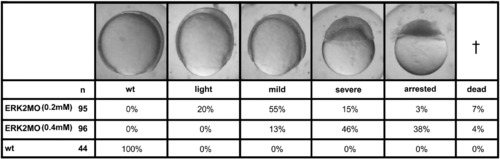
Classification of phenotypes of embryos injected with 0.2 mM or 0.4 mM ERK2MO, compared to wild type embryos at 8–9 hpf. Classification into wild type, light, mild, severe and arrested phenotype categories is indicated by percentages. |
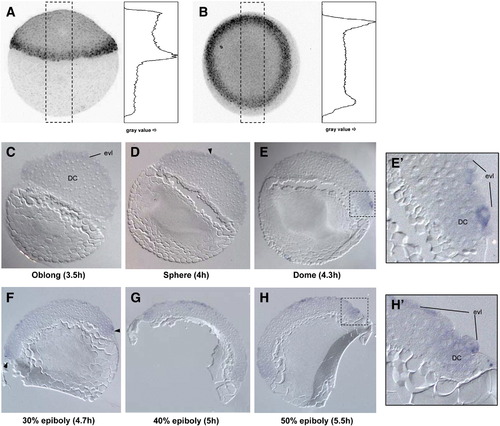
Active ERK is localized in the EVL prior epiboly and detected in EVL and marginal deep cells upon epiboly initiation. Embryos were fixed and subsequently stained for ERK activation by immuno-fluorescence at 30% epiboly (A, lateral view, dorsal to right and panel B, top view, dorsal to top) and quantified by pixel-intensity plots (gray-value in graphs). The phospho-ERK signal was weakly detected in the whole animal pole and stronger in the margin, with the strongest signal in the putative dorsal margin (B). Sectioning of embryos AP-stained for active ERK1/2 at epiboly initiation: oblong, sphere, dome, 30%-, 40%- and 50% epiboly (C–H respectively; lateral view of 8 μm section, images with Zeiss EC Plan-Neofluar 10x/0.30 objective, presumptive dorsal to right), revealed that phospho-ERK is present in the EVL from oblong–sphere stage onwards (C–H). Phospho-ERK was detected in deep cells in the margin from dome stage onwards (E–H, with magnification in panel E′ and H′). Arrowheads indicate initial detection of the signal (EVL in panel D, ventral and dorsal margin in panel F). EXPRESSION / LABELING:
|
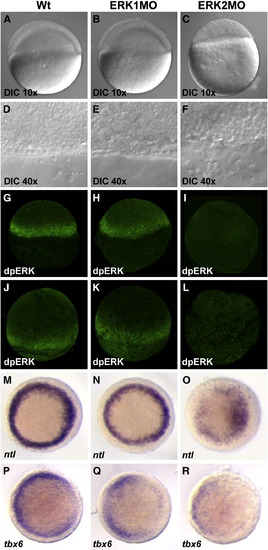
Saturating knockdown of ERK2 prohibits epiboly initiation and revealed ERK2 to be the active MAPK in the margin. Embryos were injected with 0.4 mM ERK1MO (B, E, H, K, N, Q) or ERK2MO (C, F, I, L, O, R) and compared to wild type embryos (A, D, G, J, M, P). Nomarski/differential interference contrast (DIC) microscopy using a Zeiss EC Plan-Neofluar 10x/0.30 objective (A, B, C) and a Zeiss Plan-Neofluar 40x/0.75 ∞/0.17 (D, E, F) was used to monitor the margin at the onset of gastrulation (4.5 hpf). Localization of dpERK was detected by immuno-localization in wild type, ERK1MO and ERK2MO injected embryos at 4.5 hpf (G–I) and 8 hpf (J–L) by phospho-specific ERK antibody. Images in panels G–L were taken by confocal laser scanning microscopy. Mesoderm formation was followed using in situ hybridization markers ntl (M–O) and tbx6 (P–R), top view, presumptive dorsal side right. EXPRESSION / LABELING:
|
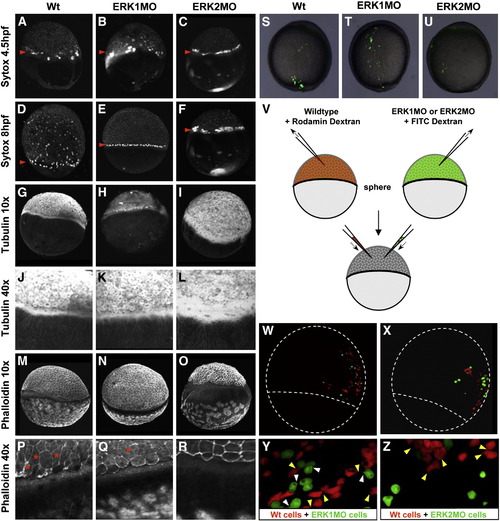
Depletion of active ERK2 affects migration of the YSL, cytoskeleton reorganization and cell shape. (A–F) YSL-migration was followed in vivo by co-injection of 10 mM sytox green at 4.5 hpf (A–C) and 8 hpf (D–F). The animal-to-vegetal migration of the YSN within the YSL is indicated with a red arrowhead. The YSL of ERK2 morphants does not migrate to the vegetal pole in time (C, F) as in wild type embryos (A, D) or ERK1 morphants (B, E; slightly delayed). (G–L) Tubulin cytoskeleton was analyzed by antibody staining (G–I, Zeiss EC Plan-Neofluar 10x/0.30 objective; J–L, Zeiss Plan-Neofluar 40x/0.75 ∞/0.17). Tubulin structures nicely condensate at the vegetal base of the YSL in wild type embryos (G, J) and ERK1 morphants (H, K), but this is perturbed in ERK2 morphants (I, L). (M–R) Actin cytoskeleton was analyzed by Phalloidin staining (M–O, 10x objective; P–R, 40x objective). Local actin recruitment in the YSL is observed in both wild type (M,P) and ERK1 morphants (N, Q), but not in ERK2 morphants (O, R). The red asterisks indicate stretched cells, only observed in wild type and ERK1 morphants. (S, T, U); lateral view, dorsal to right. FITC dextran-labeled wild type, ERK1MO or ERK2MO is transplanted into wild type hosts and grown to complete epiboly. (V); Schematic representation of a double transplantation experiment. Wild type embryos are injected with Rhodamin dextran, morphant embryos are co-injected with FITC dextran. Embryos are grown till sphere stage and cells from both donor embryos are transplanted into the anima pole of a wildtype acceptor embryo and let to develop. (W, X) Overlay of images taken by confocal laser scanning microscopy of co-transplanted wild type (red) and ERK1 or ERK2 morphant cells (green) into wild type hosts at approximately 7 hpf, with enlargements in (S, T). Yellow arrowheads indicate filopodia formation by wild type cells; white arrowheads indicate filopodia formation by morphant cells (only in panel S). Dotted lines in panels W and X indicate epiboly progression and the outline of the embryo. |
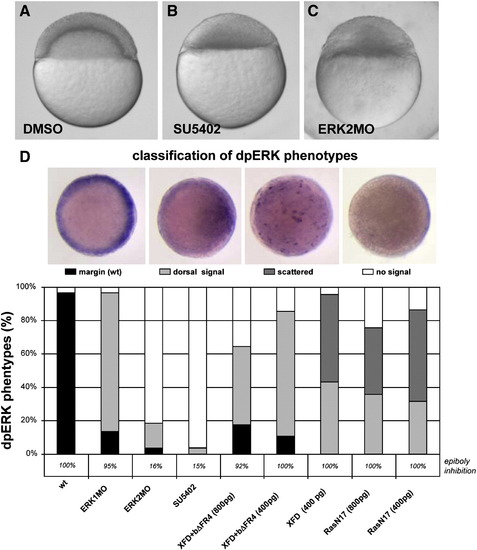
Chemical inhibition of FGF signaling phenocopies ERK2MO affects and prevents epiboly initiation. Representative embryos treated with DMSO (A), SU5402 (B) or injected with ERK2MO (C). Both SU5402 (40 μM) treated and ERK2 depleted embryos do not initiate epiboly, whereas (co-)injections of synthetic mRNA encoding XFD and bΔFR4 (800 or 400 pg total, ratio 1:1), XFD only (400 pg) or Ras N17 (800 or 400 pg) did not affect epiboly initiation significantly (D; percentages indicated below the graph). (D) Injected or SU5402 treated embryos were analyzed for active ERK signaling (dpERK) after the mentioned treatment, at 4 hpf. The observed dpERK phenotypes were imaged from the top and classified in 4 groups; staining in the margin like in wild type conditions (wt; black), depletion of dpERK from the margin, but still present at the putative dorsal side (dorsal signal; light gray), no signal in the margin, but scattered pattern of cells expressing dpERK (scattered; dark gray) and no signal detected (white). The different phenotypes were scored per treatment and the percentages were plotted in a graph (D). |
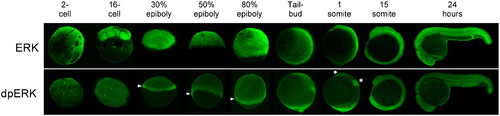
Spatio-temporal distribution of global ERK protein, compared to active dual-phosphorylated ERK (dpERK) protein by immuno-histochemistry. DpERK signal was stronger on the cleavage-sites (2-cell and 16-cell stage). During gastrulation dpERK signal was enhanced in the margin (►). After completion of gastrulation stronger signals were observed in the tailbud, MHB (*) and the anterior neural boundary (●). (5x objective, Biorad confocal laser scanning microscope). |
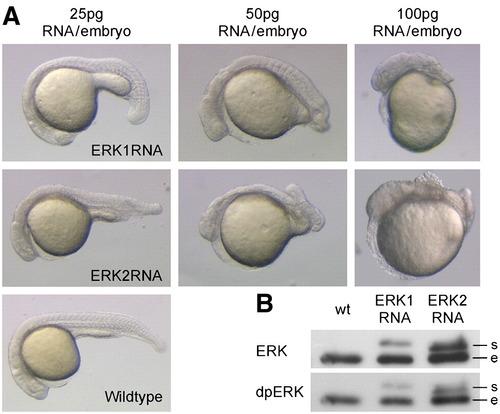
Over-expression of erk1 and erk2 led to concentration-dependent phenotypes. (A) Embryos were injected with 25, 50 or 100 pg erk1 RNA or erk2 RNA per embryo and developmental phenotypes were recorded at 24 hpf. (B) Western blot analysis was performed with global ERK and dpERK antibody on protein samples of 100 pg RNA injected embryos in shield stage. The proteins derived from synthetic mRNAs (s) are slightly larger than the endogenous proteins (e) due to the introduction of a small linker, and can therefore be distinguished by size. |
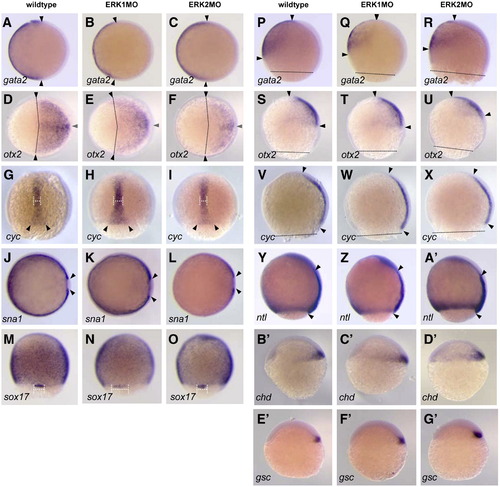
Expression of embryonic patterning marker genes in ERK1 and ERK2 morphants Expression of mRNA was detected by whole mount in situ hybridization. (A–F, J–L); animal pole view, dorsal to right, (G–I,M–O) dorsal view, animal pole to top, (P–G′) lateral view, dorsal to right, animal pole to top. (A–C, P–R) gata2, expressed in non-neural ectoderm, at 80% epiboly. (D–F, SU) otx2, expressed in ectoderm at, 90% epiboly. (G–I, V–X)) cyclops/ndr2 in axial mesoderm at 80–90% epiboly. (J–L) snail1a in paraxial mesoderm at 90% epiboly. (M–O) sox17 in endoderm and forerunner cells at 80% epiboly. (Y–A′) notail in margin an axial mesoderm at 90% epiboly. (B′–D′) chordin in presumptive dorsal shield. (E′–G′) goosecoid in presumptive dorsal shield. Arrowheads mark the different boundaries of the different marker gene expression domains; the dotted line in P–X marks the boundary of epiboly progression. EXPRESSION / LABELING:
|
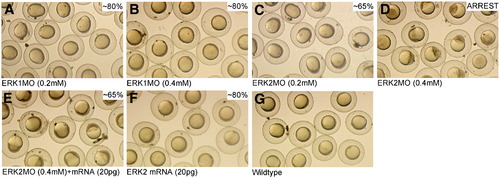
Specific functions of ERK1 and ERK2 revealed by concentration-dependent knockdown during early embryogenesis. Embryos were injected with 0.2 mM (1.7 ng) and 0.4 mM (3.4 ng) ERK1MO (A,B) or ERK2MO (C,D) respectively. Rescue was performed by co-injection of 3.4 ng ERK2MO with 20 pg ERK2 mRNA (E) and compared to phenotypes of 20 pg ERK2 mRNA injected (F) and wild type embryos at 8 hpf (G). |
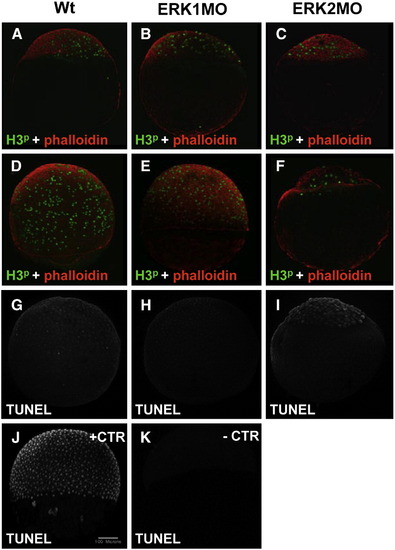
Depletion of ERKs does not induce proliferation or apoptosis defects during early developmental stages. Proliferation was analyzed by immuno-histochemistry (A–F) of phospho-histone H3 (H3p) and counterstained with Phalloidin-rhodamin of wild type ERK1MO and ERK2-O injected embryos at 4.5 (A–C) and 8 hpf (D–F). TUNEL in situ cell-death staining in wild type embryos (G) compared to ERK1MO (H) and ERK2MO (I) injected embryos at 8 hpf (G–K). As a positive control, wild type embryos were treated with DNAse after fixation (J; + CTR), which resulted in positive DNA staining of the nuclei. As a negative control, embryos were stained with developer only (K; - CTR), which gave no background signal. |
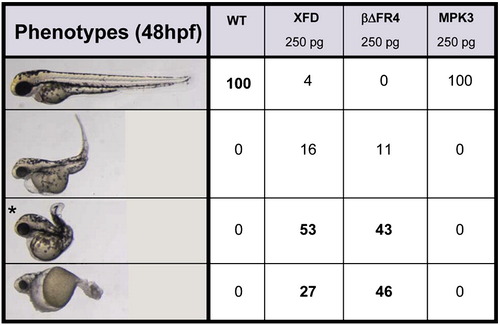
Ectopic expression of dominant negative FGFR results in similar phenotypes as ERK1 and ERK2 morphants at 48 hpf. Injection of 250 pg synthetic mRNA encoding dominant negative FGFR1 (XFD), or dominant negative FGFR4 (bΔFR4), resulted in different phenotypes at 48 hpf, of which one class (indicated with an asterisk) was highly similar to the phenotypes observed in ERK1 and ERK2 morphants at 48 hpf. Over-expression of MKP3 did not lead to any obvious phenotypes at this concentration. |
Reprinted from Developmental Biology, 319(2), Krens, S.F., He, S., Lamers, G.E., Meijer, A.H., Bakkers, J., Schmidt, T., Spaink, H.P., and Snaar-Jagalska, B.E., Distinct functions for ERK1 and ERK2 in cell migration processes during zebrafish gastrulation, 370-383, Copyright (2008) with permission from Elsevier. Full text @ Dev. Biol.