
- Title
-
FoxA3 and goosecoid promote anterior neural fate through inhibition of Wnt8a activity before the onset of gastrulation
- Authors
- Seiliez, I., Thisse, B., and Thisse, C.
- Source
- Full text @ Dev. Biol.
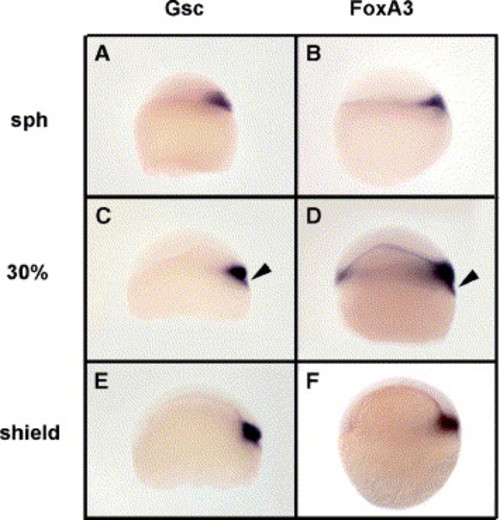
Expression of gsc and foxA3 during early developmental stages. (A, B) At sphere stage, gsc and foxA3 are expressed at the dorsal margin. (C, D) At blastula stage (30% epiboly), gsc and foxA3 transcripts colocalize at the dorsal margin with strong expression in blastodermal cells and YSL (arrowhead). (E, F) At the onset of gastrulation, gsc and foxA3 are expressed in the central part of the embryonic shield. Transcripts of both genes are no longer observed in the YSL. Embryos are in lateral view, dorsal towards the right. |
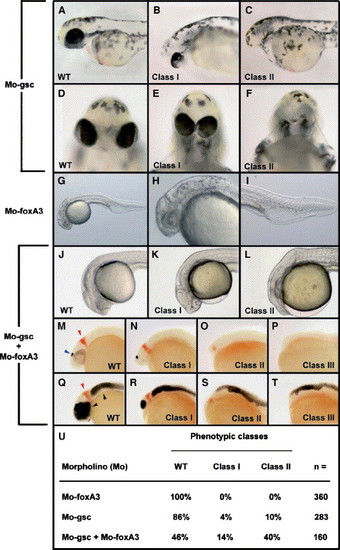
foxA3 inactivation enhances gsc loss-of-function phenotype. (A–F) Inactivation of gsc leads to head structure alterations ranging from cyclopia (class I, B and E) to a complete deletion of the anterior head (class II, C and F). (G–I) Morpholino knock-down of foxA3 results in an expansion of ventro-caudal mesenchyme (G and I) whereas the head is unaffected (H). (J–T) Double inactivation of gsc and foxA3 results in head truncation visible morphologically as a cyclopia (class I, K) or a complete deletion of anterior head (class II, L). Analysis after in situ hybridization with otx5 (epiphysis, blue, M–P) and eng2 (MHB, red, M–P) or (Q–T) with pax6 (eye, forebrain, blue) and eng2 (red) reveals much stronger phenotypes including complete loss of anterior structures from telencephalon up to MHB (class III). (U) The penetrance of class I and class II phenotypes analyzed at 24 hpf in Mo-gsc plus Mo-foxA3 injected embryos (20 pg each Mo) was also strongly enhanced compared to the Mo-foxA3 (20 pg) or Mo-gsc (20 pg) injected groups. (A–C; G–T) Lateral view, (D–F) front view. (A–F) Embryos at 36 hpf; (G–T) embryos at 24 hpf. |
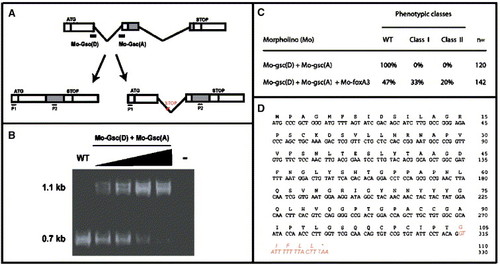
Maternal and zygotic contribution of gsc in the headless phenotype. (A) Correct and aberrant splicing of zygotic gsc pre-mRNA in the presence of morpholinos directed against the donor, Mo-gsc (D), and the acceptor, Mo-gsc (A), of splice of the first intron of the gsc gene. Exons are boxed, homeobox is in grey. P1 and P2, forward and reverse primers used for RT-PCR analysis of injected embryos. (B) RT-PCR analysis of progressive inhibition of the splicing of gsc first intron in embryos injected with a range of Mo-gsc (D) and Mo-gsc (A). The numbers on the left indicate the size of the RT-PCR products representing the aberrantly (1.1 kb) and correctly (0.7 kb) spliced RNAs. Lane 1, non-injected wild-type embryos; lanes 2–5, embryos injected with 0.6 pg, 1.2 pg, 2.5 pg and 5 pg of each morpholino, respectively; lane 6, reverse transcriptase free negative control. (C) Frequency of class I and class II phenotypes analyzed at 24 hpf in Mo-gsc (D) plus Mo-gsc (A) injected embryos (5 pg each Mo) and in embryos with an additional injection of Mo-foxA3 (10 pg). (D) Nucleic and amino acid sequence of gsc fragment generated from the aberrant splicing. Intronic region is shown in red and italic. Star indicates the stop codon. |
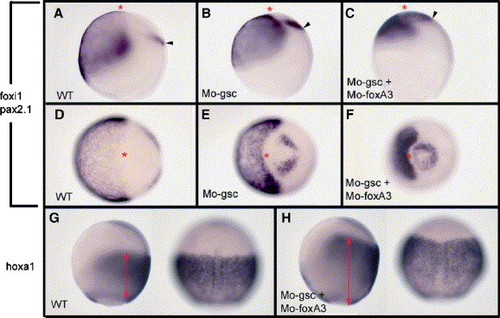
Inhibition of gsc plus foxA3 posteriorizes the ectoderm. (A–F) Expression of the presumptive epidermal marker foxi1 and the presumptive MHB marker pax2.1 in WT (A, D), gsc (B, E) and gsc/foxA3 (C, F) knock-down embryos. The region between the animal pole (red star) and the presumptive MHB (arrowhead) corresponding to the presumptive forebrain and midbrain is reduced in gsc and almost absent in gsc/foxA3 knock-down embryos. (G, H) Expression of hoxa1 in WT (G) is expanded anteriorly (red arrow) in gsc/foxA3 knock-down embryos (H). The embryos are at 80% epiboly. (A–C, G and H left) Lateral views and (D–F) animal pole view, dorsal to the right. (G and H right) Dorsal views anterior to the top. EXPRESSION / LABELING:
|
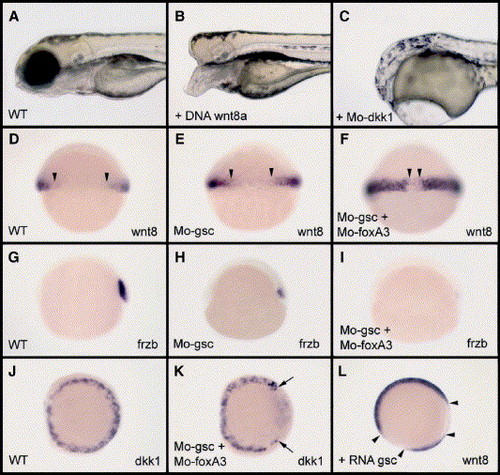
Inhibition of gsc and foxA3 results in an upregulation of Wnt signaling at the dorsal margin. Compared to wild-type (A), embryos injected with wnt8a DNA (B) or inactivation of dkk1 by morpholino knock-down (C) results in deletion of anterior head. (D–F) Expression of wnt8a at shield stage in WT (D), gsc (E) and gsc/foxa3 (F) knock-down embryos. Arrowheads indicate the dorsal borders of wnt8a expression territory. (G–I) Expression of frzb at shield stage in WT (G), gsc (H) and gsc/foxa3 (I) knock-down embryos. (J, K) Expression of dkk1 at shield stage in WT (J) and gsc/foxa3 knock-down (K) embryos. Arrows indicate the dorsal most extent domain of dkk1 expression at the margin. (L) Expression of wnt8a at shield stage in an embryo injected with gsc RNA at the 32 cell stage in one ventro-lateral blastomere. Arrowheads indicate the limit of wnt8a expression at the gastrula margin. (A, B) 96 hpf, (C) 48 hpf, (D–L) shield stage. (A–C, G–I) Lateral view, (D–F) dorsal view, (J–L) animal pole view dorsal to the right. |
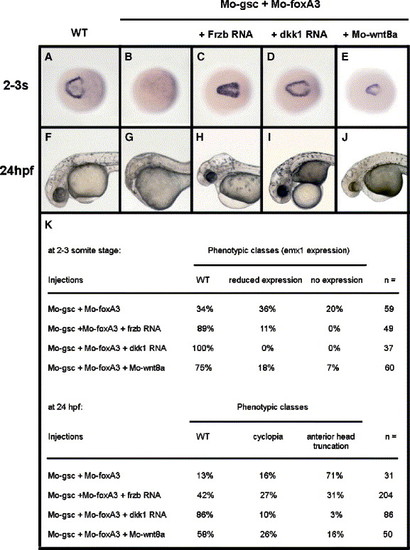
Inhibition of Wnt8a signaling rescues the headless phenotype of gsc/foxA3 knock-down embryos. Expression of the telencephalic marker emx1 in wild-type embryo (A), in double gsc/foxa3 knock-down embryo (B), in gsc/foxa3 knock-down embryo coinjected with either frzb RNA (C), dkk1 RNA (D) or wnt8a Mo (E). (F–J) Morphological analysis of embryos treated with the same conditions of injections than in panels A–E showing rescue of the head at 32 hpf when the Wnt signaling pathway is inhibited. (K) Frequency of the phenotypic classes observed for the abovementioned injections. (A–E) 2–3 somite stage, dorsal views; (F–J) lateral views at 32 hpf. EXPRESSION / LABELING:
|
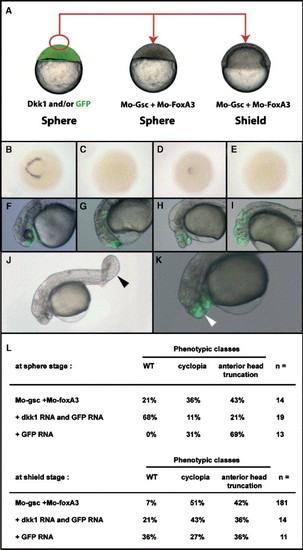
Rescue of headless phenotype by transplantation of Dkk1 expressing cells. (A) Scheme describing the experimental procedures. A group of cells from sphere stage embryos injected at the one cell stage with either dkk1 plus GFP RNA or GFP RNA alone was grafted at the animal pole of gsc/foxA3 knock-down embryos either at sphere or at shield stage. Host embryos were grown up to the 2–3 somite stage and were analyzed for the expression of emx1 or grown up to 24 hpf for morphological analyses. (B–E) emx1 expression in 2–3 somite stage embryos grafted with Dkk1/GFP expressing cells (B and D) or with GFP expressing cells (C and E). Grafts performed at sphere (B and C) or shield (D and E) stages. (F–K) Embryos grafted with Dkk1/GFP expressing cells (F, H, J, K) or with GFP expressing cells (G and I) at sphere (F, G) or shield (H, I, J, K) stages. Graft of cells expressing Dkk1 at shield stage is unable to rescue the headless phenotype (panel H and arrowhead in panel K) induced by gsc/foxA3 knock-down, whereas it results in a loss of ventral mesoderm (arrowhead in panel J) showing that Dkk1 secreted from grafted cells was able to efficiently inhibit wnt8a activity even at long distance. (L) Frequency of phenotypic classes obtained at 24 hpf after the abovementioned transplant experiments. (B–E) Dorsal views at the 2–3 somite stage, (F–K) lateral views at 24 hpf. |
Reprinted from Developmental Biology, 290(1), Seiliez, I., Thisse, B., and Thisse, C., FoxA3 and goosecoid promote anterior neural fate through inhibition of Wnt8a activity before the onset of gastrulation, 152-163, Copyright (2006) with permission from Elsevier. Full text @ Dev. Biol.