
- Title
-
Zebrafish gcm2 is required for gill filament budding from pharyngeal ectoderm
- Authors
- Hogan, B.M., Hunter, M.P., Oates, A.C., Crowhurst, M.O., Hall, N.E., Heath, J.K., Prince, V.E., and Lieschke, G.J.
- Source
- Full text @ Dev. Biol.
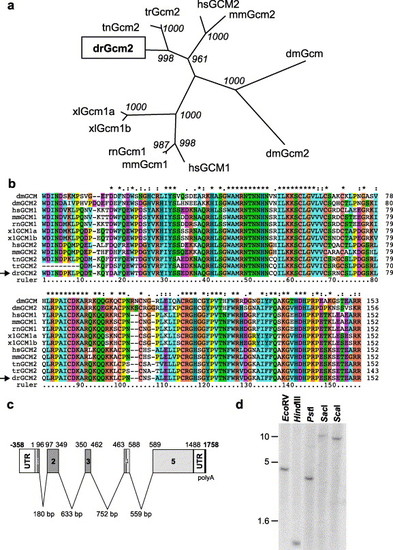
Cloning of zebrafish gcm2. (a) Unrooted phylogenetic tree of Glial cells missing family members in alignment below (b). Danio rerio (zebrafish) gene is boxed and falls into the gcm2 clade. Bootstrap values are shown at nodes. Human (hs), Mouse (mm), Rat (rn), Zebrafish (dr), Fugu (tr), Tetraodon (tn), Xenopus (xl) and Drosophila (dm). (b) Multiple sequence alignment of Glial cells missing family members, spanning the DNA binding domain. Alignment was generated using the conserved DNA binding sequences only (from “WDIND” to “EARR” sequence). Danio rerio sequence is indicated by an arrow. (c) Depiction of the cDNA and genomic structure of the zebrafish gcm2 gene. Intron sequences were elucidated from the Sanger Centre trace sequence repositories and aligned contig sequences. Sequence analysis identified the start codon at 359 bp and identified an ORF of 1488 bp encoding a 496-amino acid protein. The gcm2 intron structure is conserved compared with the mouse and human genes, which also contain four small introns in the 52 coding sequence including sequence encoding the conserved N-terminal DNA binding domain, which spans the first four exons. The coding sequence is shown in light grey, the conserved DNA binding domain in dark grey, the untranslated region (UTR) in white and the polyA tail in black. (d) Genomic Southern blot using sequences corresponding to the gcm2 DNA binding domain as a probe. Restriction enzymes used are indicated and size bars indicate fragment size in kilobases. |
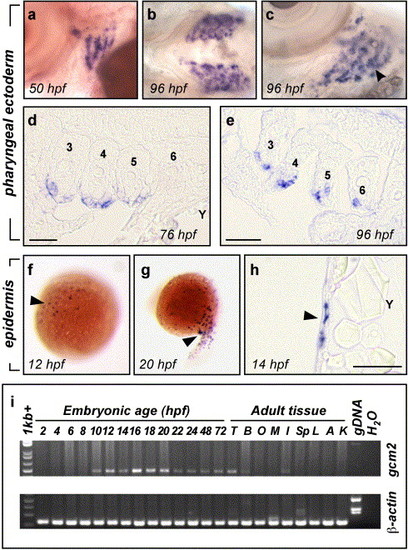
Embryonic expression of zebrafish gcm2. (a, b, c) Whole mount in situ hybridisation detected gcm2 transcripts in the pharyngeal arches. Transcripts were detected in arches 3–6 at 50 hpf and by 96 hpf were present in distinct buds at the surface of the arches. Lateral view of 50 hpf embryo (a) showing expression in arches 3–6. Ventral view of 96 hpf embryo (b) showing expression specific to the developing gill arches and not impinging on the ventral midline. Ventro-lateral view of the left gill arches (c) showing expression of gcm2 in gill filament buds (arrowhead). (d, e) Sections through the pharyngeal arches of embryos post in situ hybridisation for gcm2. At 76 hpf (d) and 96 hpf (e), expression was restricted to the pharyngeal external (lateral) ectodermal epithelium surrounding arches 3–6 (labelled). Rostral is to the left of the image and medial to the top, Y = yolk. Scale bars indicate 50 μm. (f–h) Whole mount in situ hybridisation detected gcm2 expression in a population of superficial epidermal cells. Expression of gcm2 in dispersed cells (arrowhead) at 12 hpf (f) and 20 hpf (g). (h) Cross-section demonstrating that the gcm2 expressing cells (arrowhead) are immediately sub epithelial (Y = yolk, scale bar = 50 μm). (i) RT-PCR detection of gcm2 transcripts during zebrafish embryogenesis and in adult tissues. cDNA templates for lanes (left to right) are 2–24 hpf (staged every 2 h), 48 and 72 hpf staged embryos; testis (T); brain (B); eggs and ovaries (O); muscle (M); crude skin and adipose extract (I); spleen (Sp); liver (L); airbladder (A); kidneys (K); genomic DNA (gDNA) and water (H20). β-actin control is shown below. gcm2 transcripts were first detected in 10 hpf cDNA, and throughout development to 72 hpf. Expression of gcm2 was also detected in cDNA from adult brain, testis and a crude skin and adipose tissue extract. The primers spanned introns and amplified larger fragments from gDNA. |
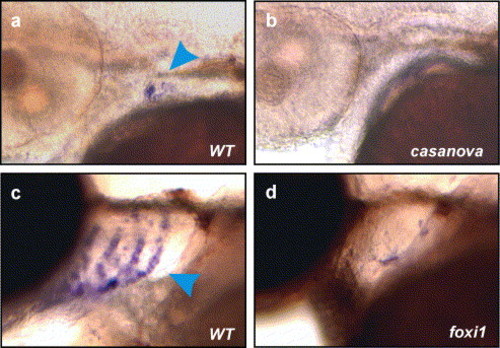
Specification and patterning of pharyngeal endoderm is required for ectodermal expression of gcm2. (a, b). casanova is required for the expression of gcm2. gcm2 transcripts were detected by in situ hybridisation at approximately 48 hpf in wild-type, cas+/?, siblings (arrowhead in a) from a cross between known casanova heterozygotes, but staining was absent in casanova, cas-/- mutants (b). (c, d). foxi1 is required for the expression of gcm2. gcm2 transcripts were detected by in situ hybridisation at 72 hpf in wild type, foxi1+/? siblings from a cross between known heterozygotes for foxi1 (arrowhead in c), but staining was severely reduced or absent in foxi1-/- mutants (d). EXPRESSION / LABELING:
|
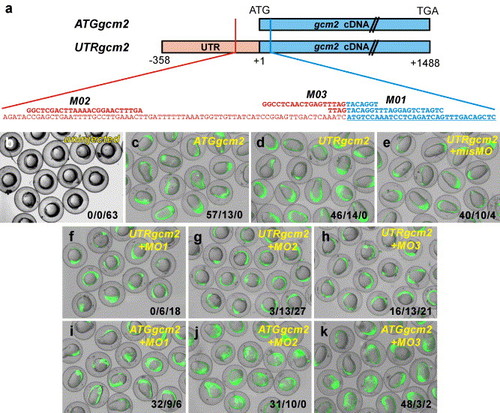
Validation of gcm2 morpholino oligonucleotide activity. (a) Representation of reagents used in a two-injection rescue experiment. Two pCS2+-based constructs were built to enable synthesis of two different gcm2 capped mRNA transcripts. The ATGgcm2 mRNA contained the full gcm2 coding sequence but did not include the full binding sites for any of the morpholino oligonucleotides used. The UTRgcm2 mRNA contained 5′ UTR and the full gcm2 coding sequence and the full binding sites for the morpholino oligonucleotides MO1, MO2 and MO3. UTR is represented in red, coding sequence in blue. (b–k) Rescue of the gcm2 overexpression phenotype occurred only in the presence of complete morpholino oligonucleotide binding sites. In this experiment, test mRNA (50 or 100 ng/μL) was injected at the 1–2 cell stage and morpholinos injected via a second separate needle at the 2–4 cell stage. mRNA encoding enhanced green fluorescent protein (EGFP) was co-injected (15 ng/μL) with test mRNA as a tracer of mRNA delivery and as a further specificity control. Injections of ATGgcm2 and UTRgcm2 mRNA resulted in a highly reproducible early axis-patterning defect (c, d), which was not rescued by a separate, second injection of the mis-matched control morpholino (misMO) (e) and was not observed in uninjected embryos (b). A second separate injection of MO1, MO2 or MO3 rescued the overexpression phenotype in UTRgcm2 mRNA injected embryos (f–h) but not in ATGgcm2 mRNA injected embryos (i–k), nor did any morpholino affect EGFP expression. Combined scores from two separate experiments are shown in the bottom right of each panel in three categories of phenotype severity: grossly elongated embryos/mildly dysmorphic embryos/phenotypically normal embryos. Merged false color images are shown, with green indicating the presence of EGFP. |
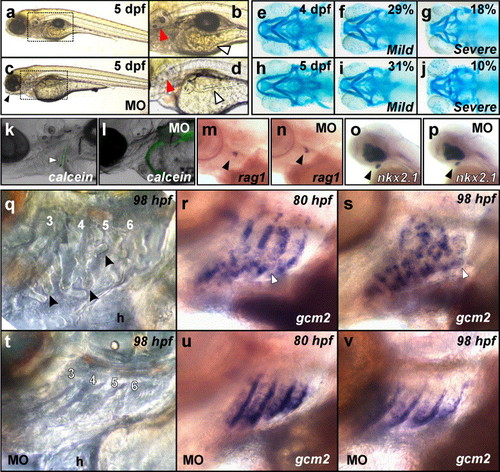
gcm2 is required for craniofacial development and gill filament budding. (a–d) Light microscope images of 5 dpf embryos injected with the standard control morpholino (a, b) and MO1 (c, d). (a, b) Standard control morpholino injected embryo at 5 dpf displaying normal otolith, gastrointestinal and jaw development. Mis-matched control-injected embryos (n = 160) were indistinguishable from random-sequence morpholino or uninjected control-injected embryos. (b is enlarged image of boxed section in a). (c, d) gcm2 morphants display a failure of jaw protrusion (black arrow in c), hypoplastic intestine (white arrow in d), abnormal yolk absorption and underdeveloped otoliths (red arrow in d). The morphant phenotype was generated with an ATG targeted morpholino, MO1 (approximately 7.5 ng/embryo), at 98% frequency (n = 167). The phenotype was reproduced with an injection of two morpholino oligonucleotides combined (78% frequency, n = 84): a 5′ untranslated region targeted morpholino, MO2; and a second ATG targeted morpholino, MO3 (approximately 3.75 + 3.75 ng/embryo), which partially overlaps with the MO1 sequence. d is enlarged image of boxed section in c. (e–j) Morphants display specific defects in craniofacial cartilage development at 4 and 5 dpf. Four dpf uninjected and random-sequence morpholino-injected control embryos (n = 12) (e) stained with Alcian blue displayed wild-type craniofacial cartilages for this timepoint. gcm2 morphants (n = 67) displayed either “mild” defects in craniofacial cartilage development (29% of embryos scored) (f) or “severe” defects in craniofacial development (18% of embryos scored) (g). The mis-matched control morpholino failed to produce the phenotypes described (n = 27). Five dpf uninjected and random-sequence morpholino (n = 21) control embryos (h) stained with Alcian blue displayed wild-type craniofacial cartilages for this timepoint. gcm2 morphants (n = 79) displayed either “mild” defects in craniofacial cartilage development (31% of embryos scored) (i) or “severe” defects in craniofacial development (10% of embryos scored) (j). The mis-matched control morpholino failed to produce the phenotypes described (n = 35). (k, l) Reduced calcein staining in morphants. Calcein staining of the cleithrum at 4 dpf was invariable in uninjected controls (arrowhead in k) and in mis-matched morpholino injected controls (n = 43), but was absent in MO2 + MO3 injected morphants at 4 dpf (80% of embryos scored, n = 45) (l). (m, n) Normal rag1 expression in morphants. In situ hybridisation for rag1 at 76 hpf stained the developing thymus in uninjected controls (arrowhead in m) and in morphants (arrowhead in n). (o, p) Normal nkx2.1 expression in morphants. In situ hybridisation for nkx2.1 stained the developing thyroid at 44 hpf in uninjected controls (arrowhead in o) and in morphants (arrowhead in p). (q. t). Gill filament buds were absent or vastly reduced in morphants at 98 hpf. Gill filament buds were observed under DIC microscopy in uninjected controls at 98 hpf (n = 29) (q) but were absent or vastly reduced in morphants (n = 20/26 embryos for MO1 injected and n = 28/31 for MO2 + MO3 injected) (t). Buds are indicated by arrowheads, arches 3–6 are labelled, h = heart. (r, s, u, v). Gill filament buds expressing gcm2 were absent in gcm2 morphants. in situ hybridisation for gcm2 transcripts at 80 hpf in uninjected controls (r) showed the budding of gill filament buds as ruffled staining of arches 3–6 (arrowhead) (n = 20) which was absent or vastly reduced in morphants (n = 12/14 for MO1 injected, n = 33/40 for MO2 + MO3 injected) (u). in situ hybridisation for gcm2 transcripts at 98 hpf in uninjected controls (s) also showed the budding of gill filament buds (arrowhead) (n = 30) which was absent or vastly reduced in morphants (n = 16/26 MO1 injected, n = 48/50 MO2 + MO3 injected) (v). Five mismatched control injected embryos were indistinguishable from uninjected control embryos at 98 hpf (n = 22). |
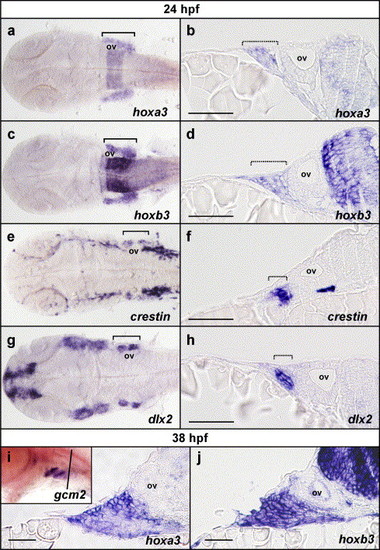
Pharyngeal hoxa3 and hoxb3 expression is not restricted to the neural crest and includes external cells of the ectoderm. (a–h) Flat-mounted embryos and transverse sections of embryos post in situ hybridisation at 24 hpf for hoxa3, hoxb3, crestin and dlx2. Expression of hoxa3 (a) and hoxb3 (c) in the pharyngeal region is detected broadly throughout all of the branchial region in flat-mounted embryos. Comparison with crestin expression (e) in neural crest and dlx2 expression (g) in neural crest-derived mesenchyme reveals that hoxa3 and hoxb3 are not restricted to neural crest cells or derivatives. Transverse sections through embryos post in situ hybridisation for hoxa3 (b) and hoxb3 (d) at the level of the otic vesicle, also demonstrated that hoxa3 and hoxb3 were expressed not only in the neural crest and derivatives as marked with crestin (f) and dlx2 (h) expression, but also in the surrounding cells, which included external, ectodermal cells. (i, j). Sectional analysis of hoxa3 and hoxb3 expression post in situ hybridisation at 38 hpf revealed that expression of hoxa3 (i) and hoxb3 (j) was present in the external ectoderm during the initiation of gcm2 expression. Inset in (i) is a whole mount in situ hybridisation mount for gcm2 expression at 38 hpf, showing expression in pharyngeal arches 3 and 4 but not yet in 5 and 6, indicating that this timepoint is during the initiation of gcm2 expression (the black line indicates the approximate location of sections in i and j). ov indicates the position of the otic vesicle; brackets indicate the rostro-caudal extent of branchial staining in flat-mount preparations; and hashed brackets indicate the lateral extent of branchial staining in transverse sections. Sections are oriented with lateral to the left and medial to the right. Scale bars in b, d, f and h indicate 20 μm and in i and j indicate 10 μm. EXPRESSION / LABELING:
|
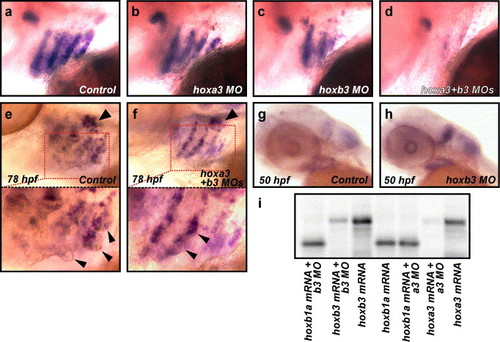
hoxb3, and in its absence hoxa3, are required for normal gcm2 expression. (a–d) Hox group 3 paralogs are required for normal gcm2 expression. Expression of gcm2 in uninjected control embryos at 52 hpf was detected by in situ hybridisation in arches 3–6 (a) and was unchanged in hoxa3 morpholino-injected embryos (b), but was reduced in hoxb3 morpholino-injected embryos (c) and further reduced in hoxa3 + hoxb3 morpholino-injected embryos (d). (e, f) Expression of gcm2 was reduced in hoxa3MO/hoxb3MO morphants in the presence of normal rag1 expression. Expression of gcm2 in distinctive gill filament buds and rag1 in the thymus was detected at 78 hpf in uninjected control embryos (n = 31/35 embryos) (arrowhead in e indicates rag1 expression, lower panel is an enlarged image of boxed section in e, arrowheads in lower panel indicate gill filament buds). Expression of rag1 was also detected in hoxa3MO/hoxb3MO morphants even in the presence of reduced gcm2 expression and reduced gill filament budding (n = 41/71 with reduced gcm2, reduced budding, rag1 positive; n = 14/71 wild type; n = 16/71 with reduced gcm2, reduced budding, rag1 negative) indicating the specificity of the reduced gcm2 phenotype (arrowhead in f indicates rag1 expression, lower panel is an enlarged image of boxed section in f, arrowheads in lower panel indicate gill filament buds). (g, h) Expression of hoxa3 was increased in the absence of hoxb3. Normal expression of hoxa3 was detected by in situ hybridisation in concurrently stained 50 hpf uninjected control embryos (g) and increased intensity of staining was detected in 50 hpf hoxb3MO-injected embryos (n = 34/43) (h). To control against variation in staining, we performed in situ hybridisation on mixed control and MO injected batches, ensuring consistent staining between MO and control injected embryos. We used tail-clipping of experimental groups to provide simple identification of control or MO injected embryos post in situ hybridisation. The identical experiment using random sequence control MO embryos generated n = 33/46 hoxb3MO-injected embryos displaying more intense staining than observed in n = 48 random sequence control MO injected embryos, which was reproduced with hoxB3MOSp (data not shown). (i) Specific activity of hoxa3MO and hoxb3MO, start codon targeted morpholinos assessed by inhibition of in vitro translation assay. hoxb1a mRNA was translated efficiently in the presence of hoxa3 and hoxb3MOs (lanes 1 and 5) and in the absence of MOs (lane 4). Translation efficiency of hoxb3 mRNA in the presence of hoxb3MO (lane 2) represents <15% the translation product seen with hoxb3 mRNA only (lane 3). Translation efficiency of hoxa3 mRNA in the presence of hoxa3MO (lane 6) represents <5% the translation product seen with hoxa3 mRNA only (lane 7). EXPRESSION / LABELING:
|
Reprinted from Developmental Biology, 276(2), Hogan, B.M., Hunter, M.P., Oates, A.C., Crowhurst, M.O., Hall, N.E., Heath, J.K., Prince, V.E., and Lieschke, G.J., Zebrafish gcm2 is required for gill filament budding from pharyngeal ectoderm, 508-522, Copyright (2004) with permission from Elsevier. Full text @ Dev. Biol.