
Fig. 2
- ID
- ZDB-IMAGE-260723-40
- Genes
- Publication
- Kaveh et al., 2026 - Flow-mediated endothelial remodeling and inflammation drive developmental vascular susceptibility in ldlr loss of function
- All Figures
- Figures for Kaveh et al., 2026
|
Fig. 2
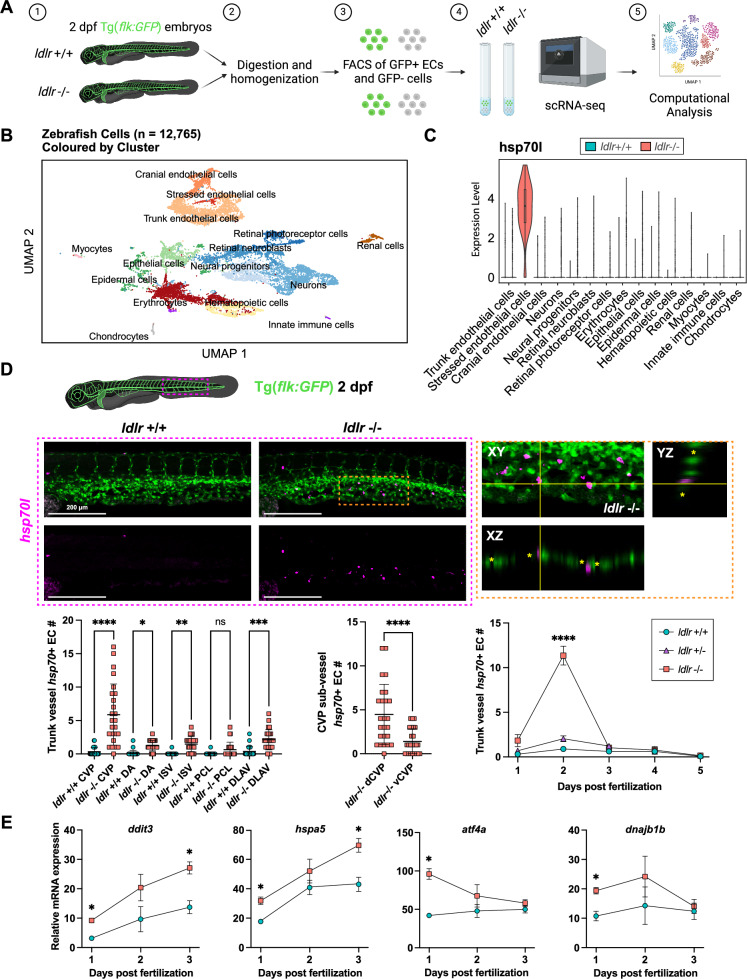
scRNA-sequencing of embryonic ldlr-/- zebrafish identifies a subpopulation of stressed endothelial cells marked by hsp70 upregulation.
A Schematic of scRNA-seq workflow in Tg(flk:GFP) ldlr + /+ and ldlr-/- zebrafish at 2 dpf. Created in BioRender. Salazar, A. (2026) https://BioRender.com/y95wgtg. B Cluster uniform manifold approximation and projection (UMAP) of 12,765 cells colored by annotated cell populations. Cells were obtained from pooled embryos (n = 200 zebrafish per genotype) processed in a single batch. C Violin plot of normalized hsp70l (cytoplasmic chaperone/unfolded protein response) expression across cell populations in ldlr + /+ and ldlr-/- zebrafish. Each violin represents single-cell expression values, the central line indicates the median, and the shape represents the kernel distribution. D Confocal microscopy of hsp70l fluorescence in situ RNA hybridization-stained trunk vasculature in ldlr + /+ and ldlr-/- zebrafish at 2 dpf (top, left). Inset shows maximum intensity projection (XY) and orthogonal z-slices (XZ and YZ planes) of hsp70 + endothelial cells adjacent to caudal venous plexus (CVP) loops (asterisks) in ldlr-/- zebrafish (top, right). Number of trunk vessel hsp70+ endothelial cells between ldlr + /+ (n = 27) and ldlr-/- (n = 25) zebrafish. DA (dorsal aorta), ISV (intersegmental vessel), PCL (parachordal lymphatic), DLAV (dorsal longitudinal anastomotic vessel) at 2 dpf. CVP (p < 0.0001), DA (p = 0.0261), ISV (p = 0.0048), PCL (p = 0.1833), DLAV (p = 0.0006); 4 independent experiments. Data are mean ± s.d. One-way ANOVA and Holm-Sidak’s multiple comparison used (bottom, left). CVP sub-vessel (dCVP and vCVP) hsp70 + endothelial cell number in ldlr + /+ (n = 25) and ldlr-/- (n = 25), p = 0.0001; 4 independent experiments. Data are mean ± s.d. Paired two-tailed t test used (bottom, middle). Number of trunk vessel hsp70 + endothelial cells in ldlr + /+ (n = 13-29), ldlr + /- (n = 13-27) and ldlr-/- (n = 12-29) zebrafish at 1 dpf (p = 0.1774), 2 dpf (p < 0.0001), 3 dpf (p = 0.5423), 4 dpf (p = 0.8054), 5 dpf (p = 0.8054); 4 independent experiments. Data are mean ± s.e.m. Two-way ANOVA and Holm-Sidak’s multiple comparison used (bottom, right). E RT-qPCR analysis of cell stress response genes: ddit3 (endoplasmic reticulum stress), hspa5 (endoplasmic reticulum chaperone), atf4a (endoplasmic reticulum stress) and dnajb1b (cytoplasmic chaperone/unfolded protein response) in ldlr + / + and ldlr-/- zebrafish 1-3 dpf. 1 dpf: ddit3 (p = 0.0151), hspa5 (p = 0.0457), atf4a (p = 0.0326), dnajb1b (p = 0.0456), 2 dpf: ddit3 (p = 0.1594), hspa5 (p = 0.3134), atf4a (p = 0.4853), dnajb1b (p = 0.5836) and 3 dpf: ddit3 (p = 0.0234), hspa5 (p = 0.0457), atf4a (p = 0.4853), dnajb1b (p = 0.6709). Expression was normalized to gapdh. Each replicate consists of n = 14–20 pooled zebrafish per group; 3 independent experiments. Data are represented as mean ± s.e.m. Two-way ANOVA and Holm-Sidak’s multiple comparison used. Source data are provided as a Source Data file.