
IMAGE
Figure 2.
- ID
- ZDB-IMAGE-240221-29
- Publication
- Andersson et al., 2024 - Loss of Fshr prevents testicular maturation in Atlantic salmon (Salmo salar L.)
- All Figures
- Figures for Andersson et al., 2024
Image
|
Figure Caption
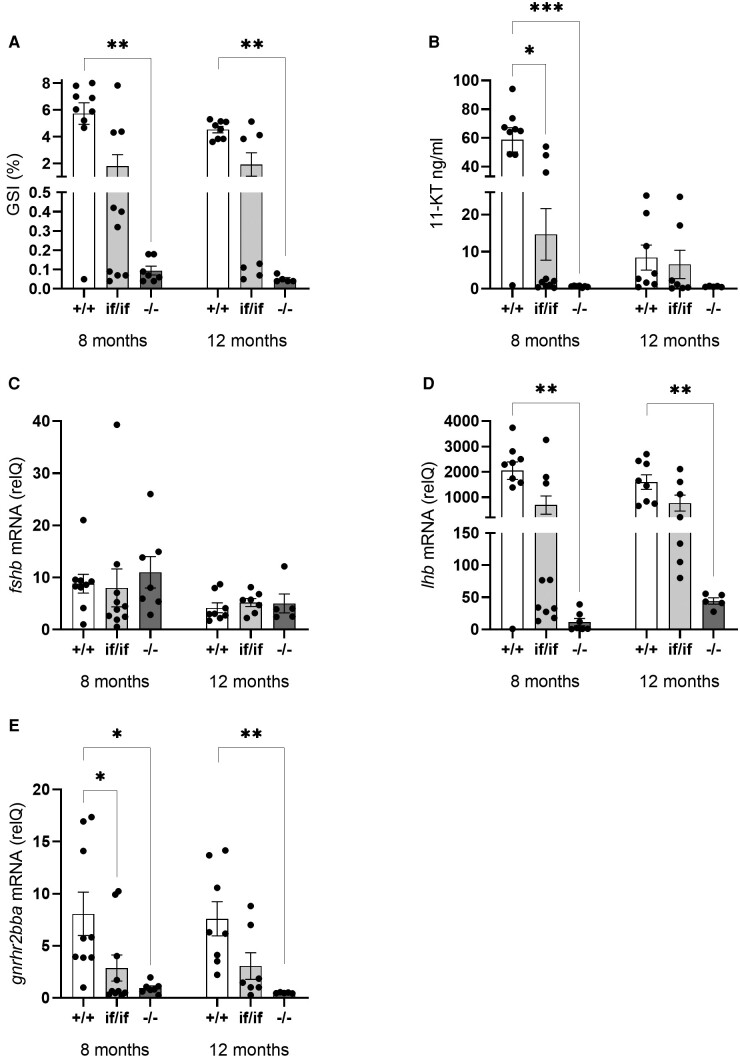
Figure 2.
Gonadosomatic indices (GSI; A), plasma 11-ketotestosterone (11-KT; B), pituitary
Acknowledgments
This image is the copyrighted work of the attributed author or publisher, and
ZFIN has permission only to display this image to its users.
Additional permissions should be obtained from the applicable author or publisher of the image.
Full text @ Endocrinology