
|
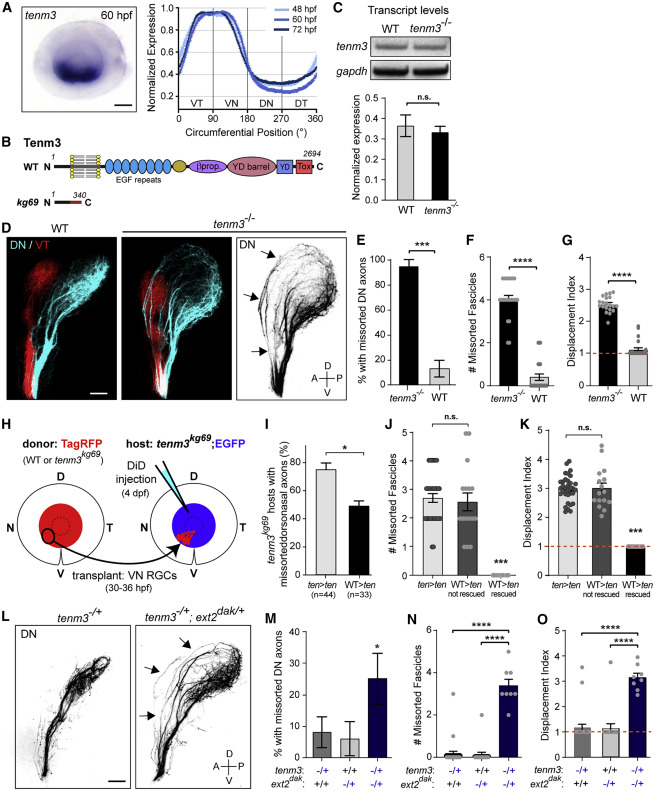
Fig. 3 tenm3 is required for pruning topographically missorted dorsal axons
(A) tenm3 ISH staining is selectively detected in the ventral RGC layer in the retina throughout development. Scale bar: 50 μm.
(B) Schematic of Tenm3 protein structure in WT and tenm3kg69 mutants. Tox, toxin-like domain; YD, tyrosine-aspartate repeat; βprop, β-propeller.
(C) Analysis of tenm3 transcript levels by RT-PCR in WT and tenm3 mutants at 4 dpf. Unpaired two-tailed t test p = 0.75. Error bars: standard errors.
(D) Pre-target sorting of DN and VT retinal axons along the optic tract at 4 dpf. Missorted DN axons are maintained along the dorsal branch of the tract in tenm3 mutants (arrows). Scale bar: 50 μm.
(E) Percentage of larvae with missorted DN axons at 4 dpf. One-sided chi-squared test with Yates’s correction, X2 (1, N = 47) = 23.30, p < 0.0001.
(F) Number of missorted DN axon fascicles in phenotypic larvae. Unpaired one-tailed t test, p ˂ 0.0001.
(G) Quantification of the displacement index in larvae with sorting defects. Unpaired one-tailed t test, p ˂ 0.0001, n = 20 mutants.
(H) VN RGCs of an isl2b:TagRFP donor embryo (WT or tenm3 mutant) were topographically transplanted between 30 and 36 hpf into the VN retina of an isl2b:EGFP tenm3 mutant host. Pre-target sorting of host DN axons was assessed by injecting DiD into the host DN retina at 4 dpf.
(I) Quantifications of the percentage of transplanted tenm3 mutant hosts with missorted DN axons. One-sided chi-squared test with Yates’s correction, X2 (1, N = 77) = 4.641, p = 0.0156.
(J) Number of missorted DN axon fascicles in tenm3 mutant hosts with sorting defects. One-way ANOVA with Tukey’s post-hoc test, p ˂ 0.0001.
(K) Quantification of the displacement index in tenm3 mutant hosts with sorting defects. One-way ANOVA with Tukey’s post-hoc test, p ˂ 0.0001. Error bars: standard errors.
(L) Pre-target sorting of DN retinal axons along the optic tract at 4 dpf. DN axons missort along the dorsal branch of the tract in tenm3−/+; ext2dak/+ larvae (arrows) but not in tenm3−/+ heterozygotes. Scale bar: 50 μm.
(M) Percentage of tenm3−/+, ext2dak/+, and tenm3−/+; ext2dak/+ larvae with missorted DN axons at 4 dpf. One-sided chi-squared test, X2 (1, N = 74) = 3.274, p = 0.035.
(N) Number of missorted DN axon fascicles in phenotypic larvae. One-way ANOVA with Tukey’s post-hoc test, p ˂ 0.0001.
(O) Quantification of the displacement index. One-way ANOVA with Tukey’s post-hoc test, p ˂ 0.0001. n = 25 tenm3−/+, 17 ext2dak/+, and 32 tenm3−/+; ext2dak/+. Error bars: standard errors.
See also Figure S6.