
Image
|
Figure Caption
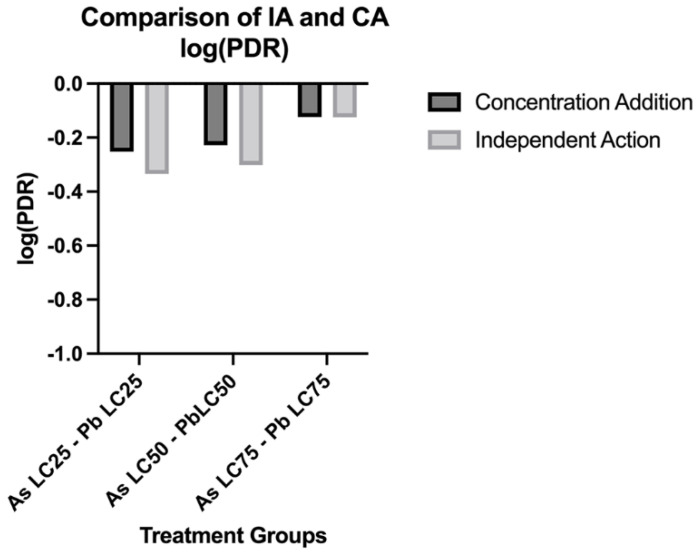
Fig. 5
Comparison of predicted lethality using the Independent Action (IA) and Concentration Addition (CA) models. The log of the prediction deviation ratios (PDR) of mixtures for the CA and IA models. N = 3 biological replicates for each treatment group with 50 subsamples per each treatment group.
Acknowledgments
This image is the copyrighted work of the attributed author or publisher, and
ZFIN has permission only to display this image to its users.
Additional permissions should be obtained from the applicable author or publisher of the image.
Full text @ Biomolecules