
Image
|
Figure Caption
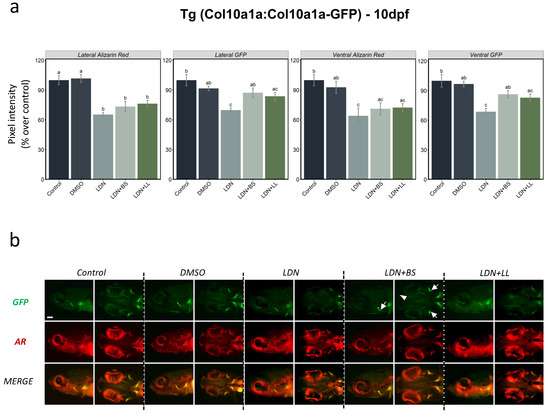
Fig. 6
Figure 6. BMP inhibitor exposure followed by two probiotics treatments in Tg(col10a1a:col10a1a-GFP) larvae. (a) Integrated pixel intensity values for various areas measured in 10 dpf zebrafish Tg(col10a1a:col10a1a-GFP) larvae divided into various groups—control, DMSO, LDN, LDN+BS and LDN+LL—and stained with AR. DMSO was used as additional control since it was employed as the solvent for LDN. One-way ANOVA and Tukey’s multiple comparison tests were used, and statistical significance was set at p < 0.05. Different letters denote statistically significant differences among the experimental groups. (b) GFP, AR staining and merged images of the head area (lateral and ventral views) of Tg(col10a1a:col10a1a-GFP) larvae of the different treated groups. White arrows denote GFP in various bony structures and the white arrowhead indicates the presence of a signal in additional structures (that was absent in other groups) in BS-treated fish after LDN exposure (LDN + BS).
Figure Data
Acknowledgments
This image is the copyrighted work of the attributed author or publisher, and
ZFIN has permission only to display this image to its users.
Additional permissions should be obtained from the applicable author or publisher of the image.
Full text @ Int. J. Mol. Sci.