
IMAGE
Figure 5
Image
|
Figure Caption
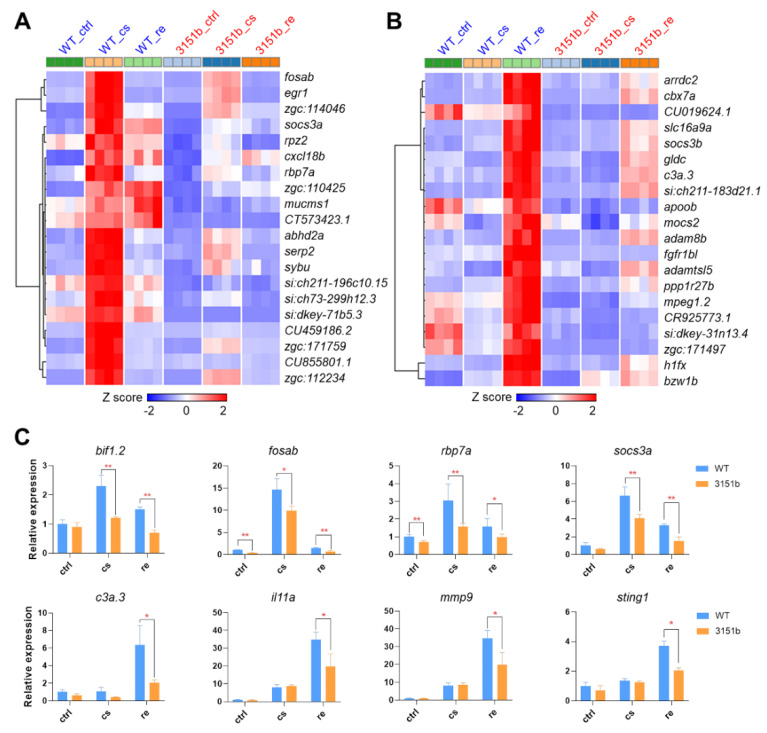
Figure 5
Representative genes affected by Tmem39b dysfunction upon cold exposure and rewarming. Heatmaps demonstrate expressions of the representative up-regulated genes upon cold exposure (
Figure Data
Acknowledgments
This image is the copyrighted work of the attributed author or publisher, and
ZFIN has permission only to display this image to its users.
Additional permissions should be obtained from the applicable author or publisher of the image.
Full text @ Int. J. Mol. Sci.