
IMAGE
Fig. 1
Image
|
Figure Caption
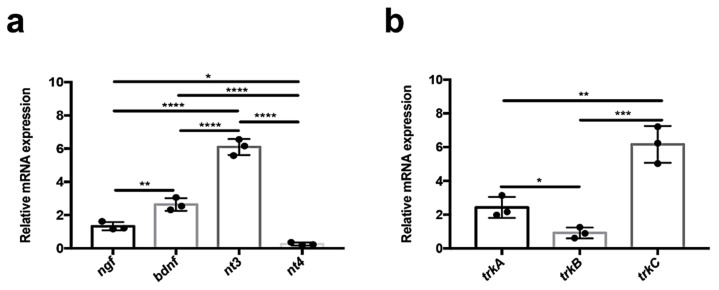
Fig. 1
Analysis of neurotrophin and receptor expression by qPCR. (a) qPCR analysis for neurotrophic factors: ngf; bdnf; nt3; nt4. ngf is more expressed than nt4 (not significatively expressed), but less than bdnf. nt3 is highly expressed compared with previous neurotrophins (* p < 0.018; ** p < 0.006; **** p < 0.0001). (b) qPCR analysis for receptors of tyrosine kinase: trkA; trkB; trkC. trkA is more expressed than trkB. However, trkC is highly expressed in the kidney compared with the expression of other receptors (* p < 0.020; ** p < 0.001; *** p < 0.0001).
Figure Data
Acknowledgments
This image is the copyrighted work of the attributed author or publisher, and
ZFIN has permission only to display this image to its users.
Additional permissions should be obtained from the applicable author or publisher of the image.
Full text @ Vet Sci