
|
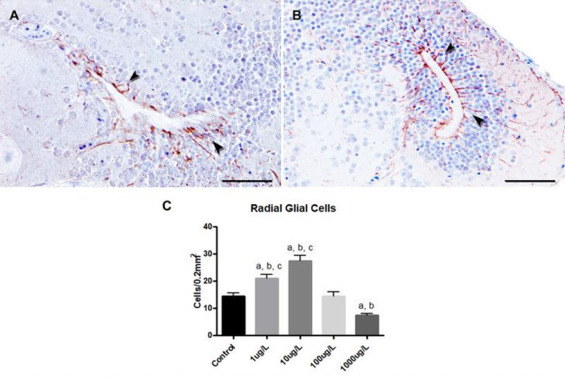
Fig. 5 Response of cyp19a1b expression in the zebrafish brain after exposure to different BPA concentrations. The radial glial cells were the main immunoreactive cells against the anti-cyp19a1b antibody (arrows) in the brain from zebrafish control (A) and exposed to 10 μg/L of BPA (B). Immunohistochemistry (ABC method). Bars: 50 μm. C) Means ± standard errors of radial glial cells immunopositive for cyp19a1b in the brain from control zebrafish and groups exposed to 1, 10, 100 and 1000 μg/L of BPA (n = 6 per group). asignificant differences vs control (p<0.05); bsignificant differences vs 100 μg/L (p<0.05); csignificant differences vs 1000 μg/L (p<0.05) (Kruskal-Wallis test followed by Dunn's multiple comparisons test for non-parametric distributions).