
Fig. 1
|
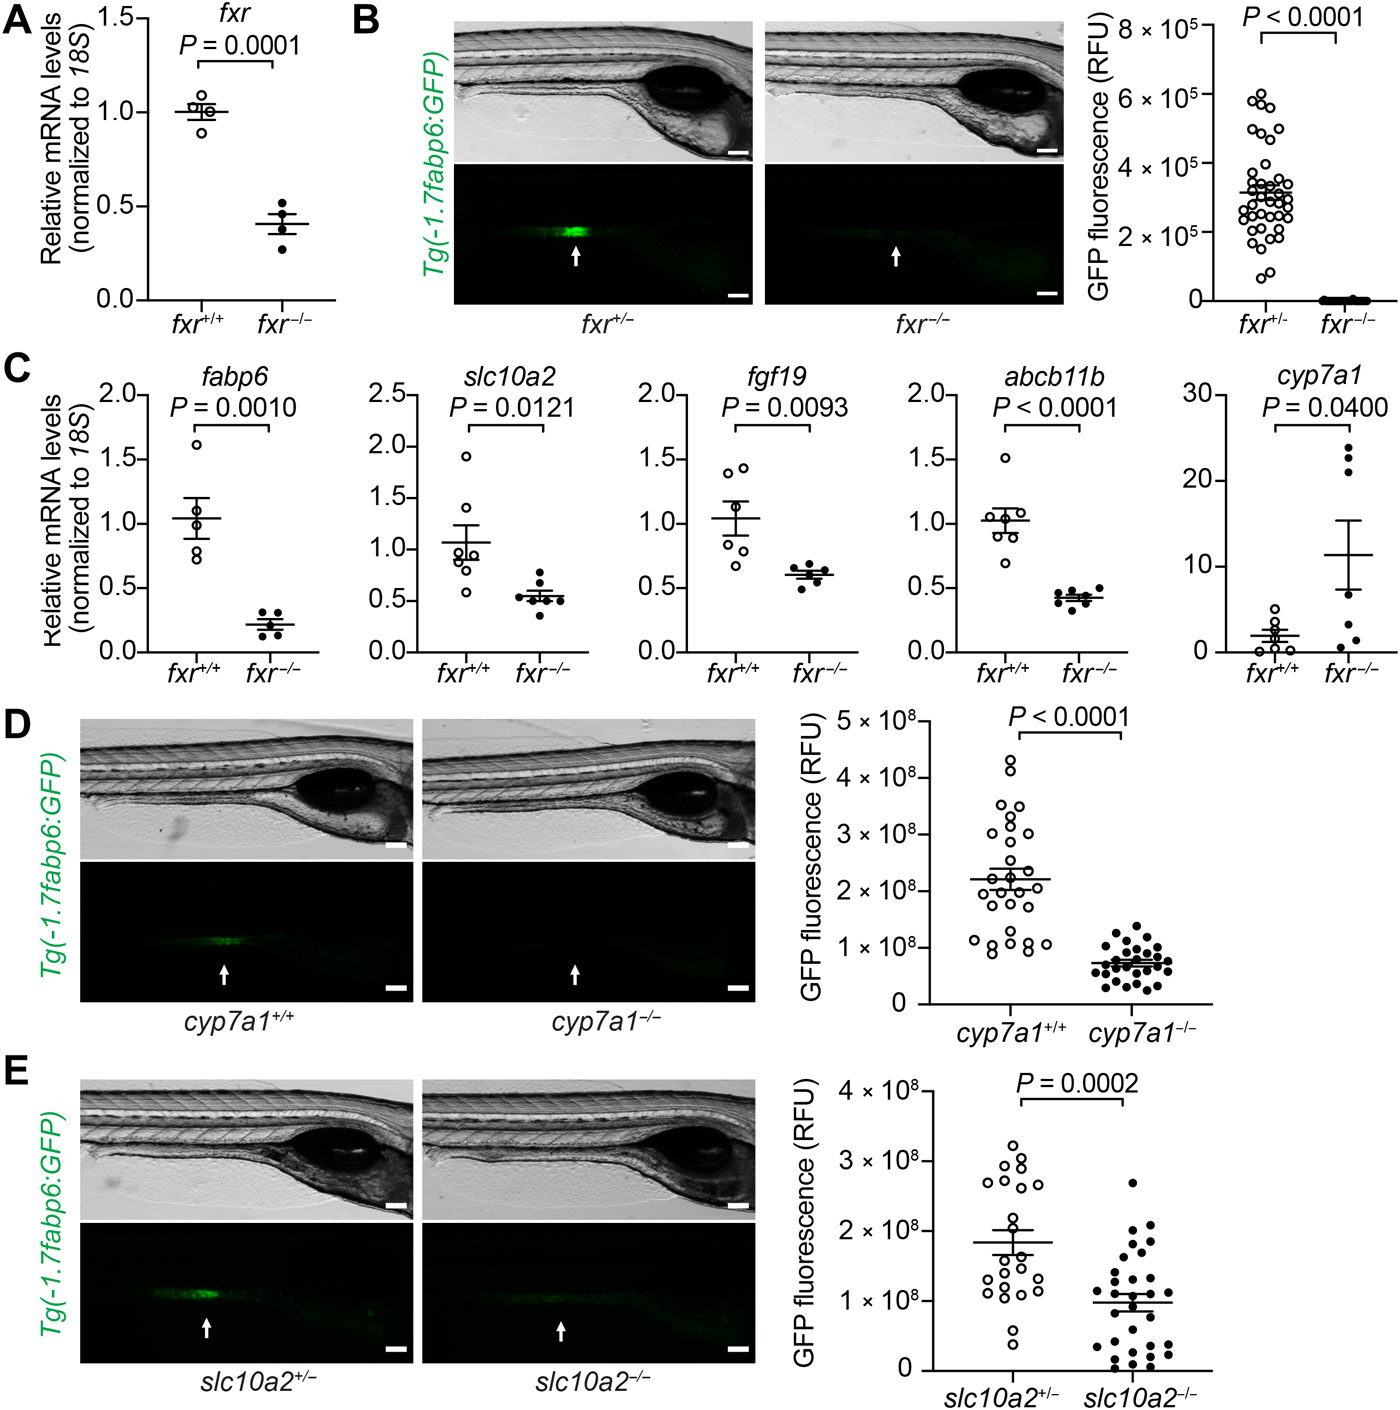
Fig. 1 Genetic analyses reveal conserved key components of the bile salt–Fxr signaling axis in zebrafish.(A) Quantitative reverse transcription polymerase chain reaction (qRT-PCR) comparing fxr expression in whole 7-day post-fertilization (dpf) fxr wild-type (wt) (fxr+/+) or fxr homozygous mutant (fxr−/−) zebrafish larvae. (B) Imaging and quantification of GFP fluorescence of the ileal region of 7-dpf fxr+/+ and fxr−/− Tg(-1.7fabp6:GFP) larvae. The ileal region is indicated by arrows. RFU, relative fluorescence unit. (C) qRT-PCR comparing expression of genes related to bile salt metabolism in dissected digestive tracts (including intestine, liver, pancreas, and gall bladder) of 7-dpf fxr+/+ or fxr−/− larvae (for fabp6, slc10a2, and fgf19) or dissected liver of gender- and size-matched adult male fxr+/+ or fxr−/− zebrafish (for abcb11b and cyp7a1). The results are represented as relative expression levels normalized to 18S (mean ± SEM). (D and E) Imaging and quantification of GFP fluorescence of the ileal region of 7-dpf Tg(-1.7fabp6:GFP) cyp7a1+/+ and cyp7a1−/− larvae (D) or slc10a2+/− and slc10a2−/− larvae (E). The zebrafish ileal region is indicated by arrows. Scale bars, 100 μm in (B), (D), and (E). Statistical significance was calculated by unpaired t test. Representative data from at least three independent experiments are shown.