IMAGE

FIGURE 1

ID
ZDB-IMAGE-210807-3
Source
Figures for Li et al., 2021
Image
Figure Caption

FIGURE 1

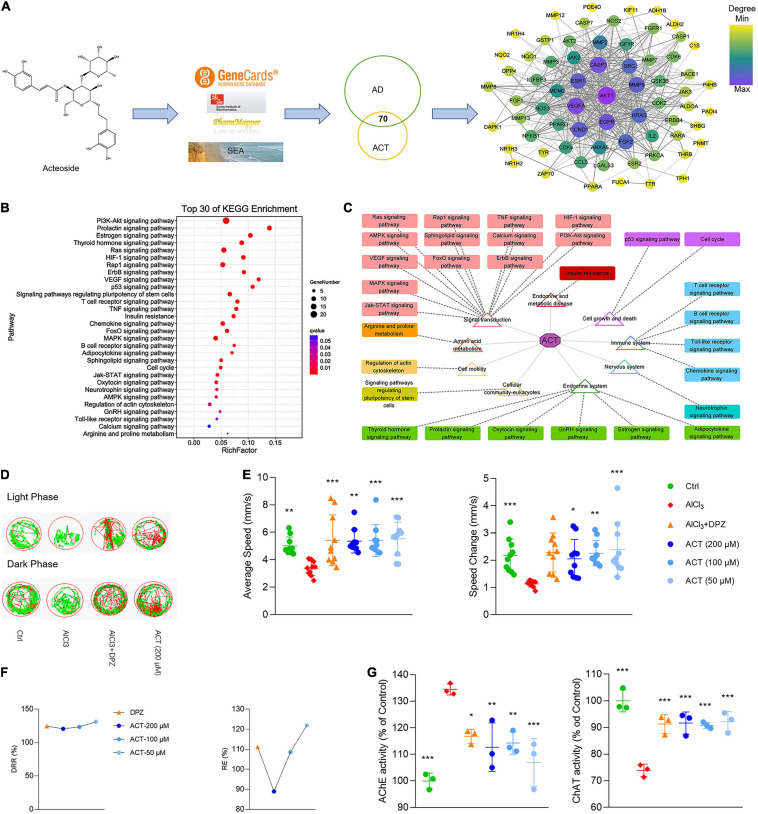
ACT attenuated AlCl3-induced AD in zebrafish larvae. (A) The workflow of ACT-AD targets interaction network modeling. The size and color of nodes represented the degree of targets. The width of edges was consistent with the combined score of targets. (B) Top 30 of KEGG enrichment. (C) Illustration of KEGG pathway enrichment analysis. (D) The representative swimming trails of zebrafish larvae in the light and dark phase. (E) The average speed and speed change in different groups (n = 10). (F) DRR (%) and RE (%) in the drug treatment groups (n = 10). (G) The evaluation of AChE and ChAT activities (n = 3). *P < 0.05, **P < 0.01, and ***P < 0.005, versus the AlCl3 group. DPZ as the positive control.

Figure Data
Acknowledgments
This image is the copyrighted work of the attributed author or publisher, and ZFIN has permission only to display this image to its users. Additional permissions should be obtained from the applicable author or publisher of the image. Full text @ Front Cell Dev Biol