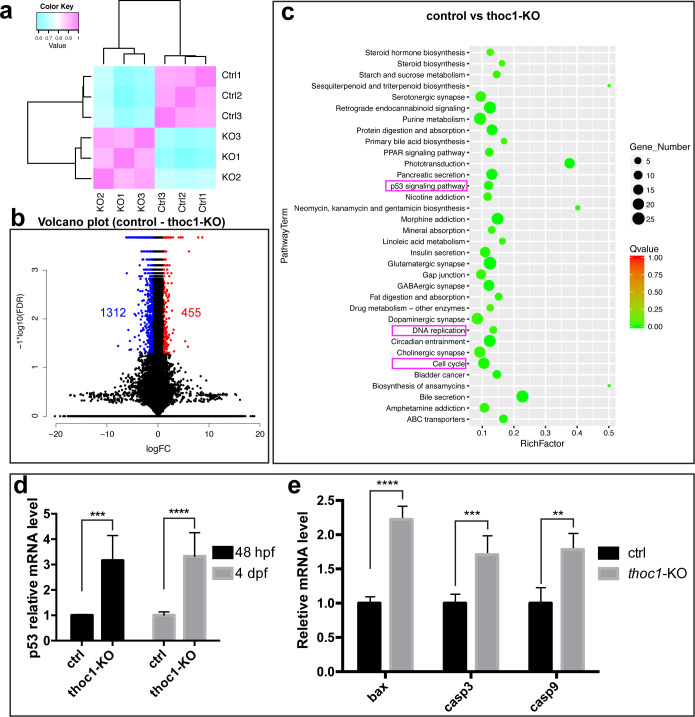
IMAGE

Fig 6

ID
ZDB-IMAGE-200829-87
Genes
Source
Figures for Zhang et al., 2020
Image
Figure Caption

Fig 6 Transcriptome sequencing analysis of 48 hpf <italic>thoc1</italic> mutants.

(a) Clustering analysis indicates the replicates within group have a good repeatability, while the control and mutated group are different. (b) Volcano diagram of different expression genes. Red dots indicate up-regulated genes; blue dots indicate down-regulated genes. Abscissa indicates gene fold change in different samples; ordinate represents statistical significance of gene expression change. (c) KEGG analysis plot of the differential gene, with the vertical axis representing the pathway and the horizontal axis representing the Rich factor. The size of the dot indicates the number of differentially expressed genes in the pathway, and the color of the dot corresponds to a different Qvalue range. (d) Relative mRNA levels of p53 in control and thoc1-KO embryos at 48 hpf and 4 dpf (three times experiments, n = 10 for each time). t-test; ***, p<0.001; ****, p<0.0001. (e) Relative mRNA levels of bax, casp3 and casp9 in control and thoc1-KO embryos at 4 dpf (three times experiments, n = 10 for each time), t-test; **, p<0.01; ***, p<0.001; ****, p<0.0001.

Figure Data
Acknowledgments
This image is the copyrighted work of the attributed author or publisher, and ZFIN has permission only to display this image to its users. Additional permissions should be obtained from the applicable author or publisher of the image. Full text @ PLoS Genet.