
|
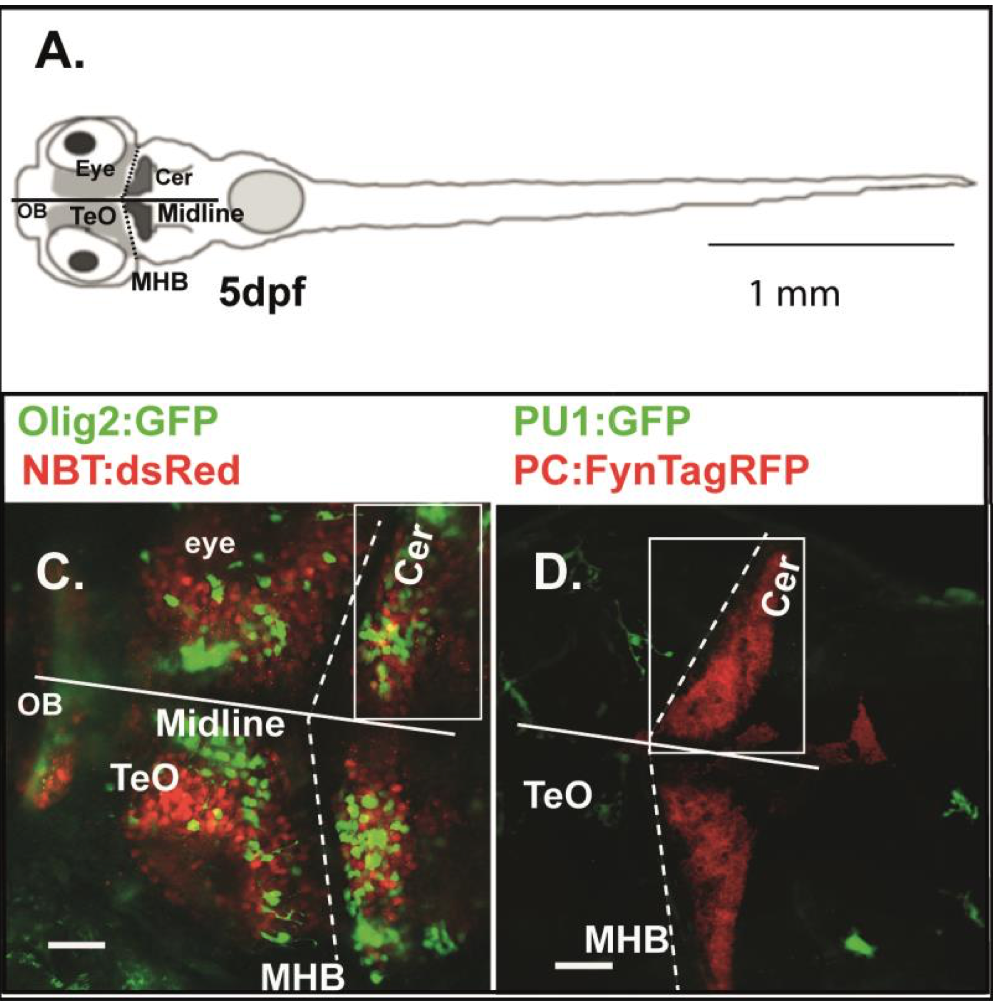
Fig. S1
Transgenic zebrafish lines and analyzed zebrafish brain regions
A: Cartoon of a zebrafish larvae on 5 dpf showing the regions analyzed in this study. TeO Tectum opticum; OB Olfactory bulb; Cer Cerebellum; MHB Midbrain-hindbrain boundary. B: WT zebrafish larvae of compound transgenics Tg:(NBT:dsRed)/Tg:(Olig2:GFP) analyzed by in vivo CLSM. Projection of a confocal z- stack highlighting neurons (red) and oligodendrocyte precursor cells (green) on 5 dpf. C: WT zebrafish larvae of compound transgenics Tg:(PU1:GFP)/ Tg:(PC:FynTagRFP) analyzed by in vivo CLSM. Projection of a confocal z-stack highlighting microglia (green) and purkinje cells (red) on 5 dpf. Size markers 40 μM.