
Fig. 7
- ID
- ZDB-IMAGE-190820-30
- Genes
- Publication
- Zhu et al., 2019 - Aplnra/b Sequentially Regulate Organ Left-Right Patterning via Distinct Mechanisms
- All Figures
- Figures for Zhu et al., 2019
|
Fig. 7
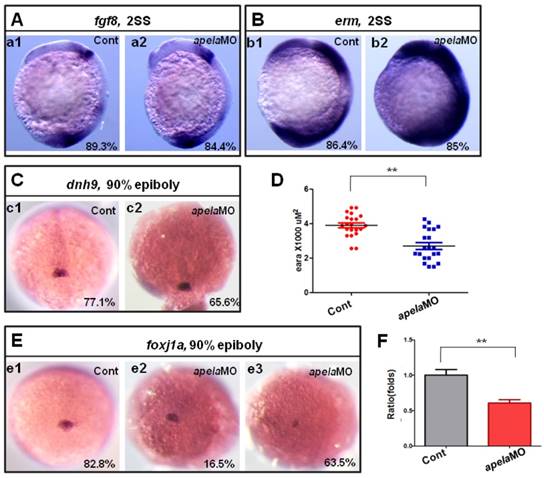
KV/cilia related signaling pathway analysis in apela morphants. (A-C) Compared with the control embryos (A. a1, B. b1 and C. c1), the expression of fgf8 and the downstream gene dnh9 were not changed in apela morphants (A. a2, 84.4%, n=32; C. c2, 65.6%, n=32), but the expression of erm was up regulated in apela morphants (B. b2, 85%, n=20). (E-D) Foxj1a was expressed in DFCs. Compared with that in control embryos (E. e1, 82.8%, n=35), foxj1awas down regulated in apela morphants (E. e3, 63.5%, n=104). The average area of foxj1a expression in control embryos and apela morphants were 3.87 x10³ uM2 (n=21) and 2.75 x10³ uM2, respectively (D, n=21, p<0.01). Q-PCR experiment indicated that foxj1a expression was down regulated with 0.61 folds compared with that in control embryos (F). *, p<0.05; **, p<0.01.