
IMAGE
Fig. S2
Image
|
Figure Caption
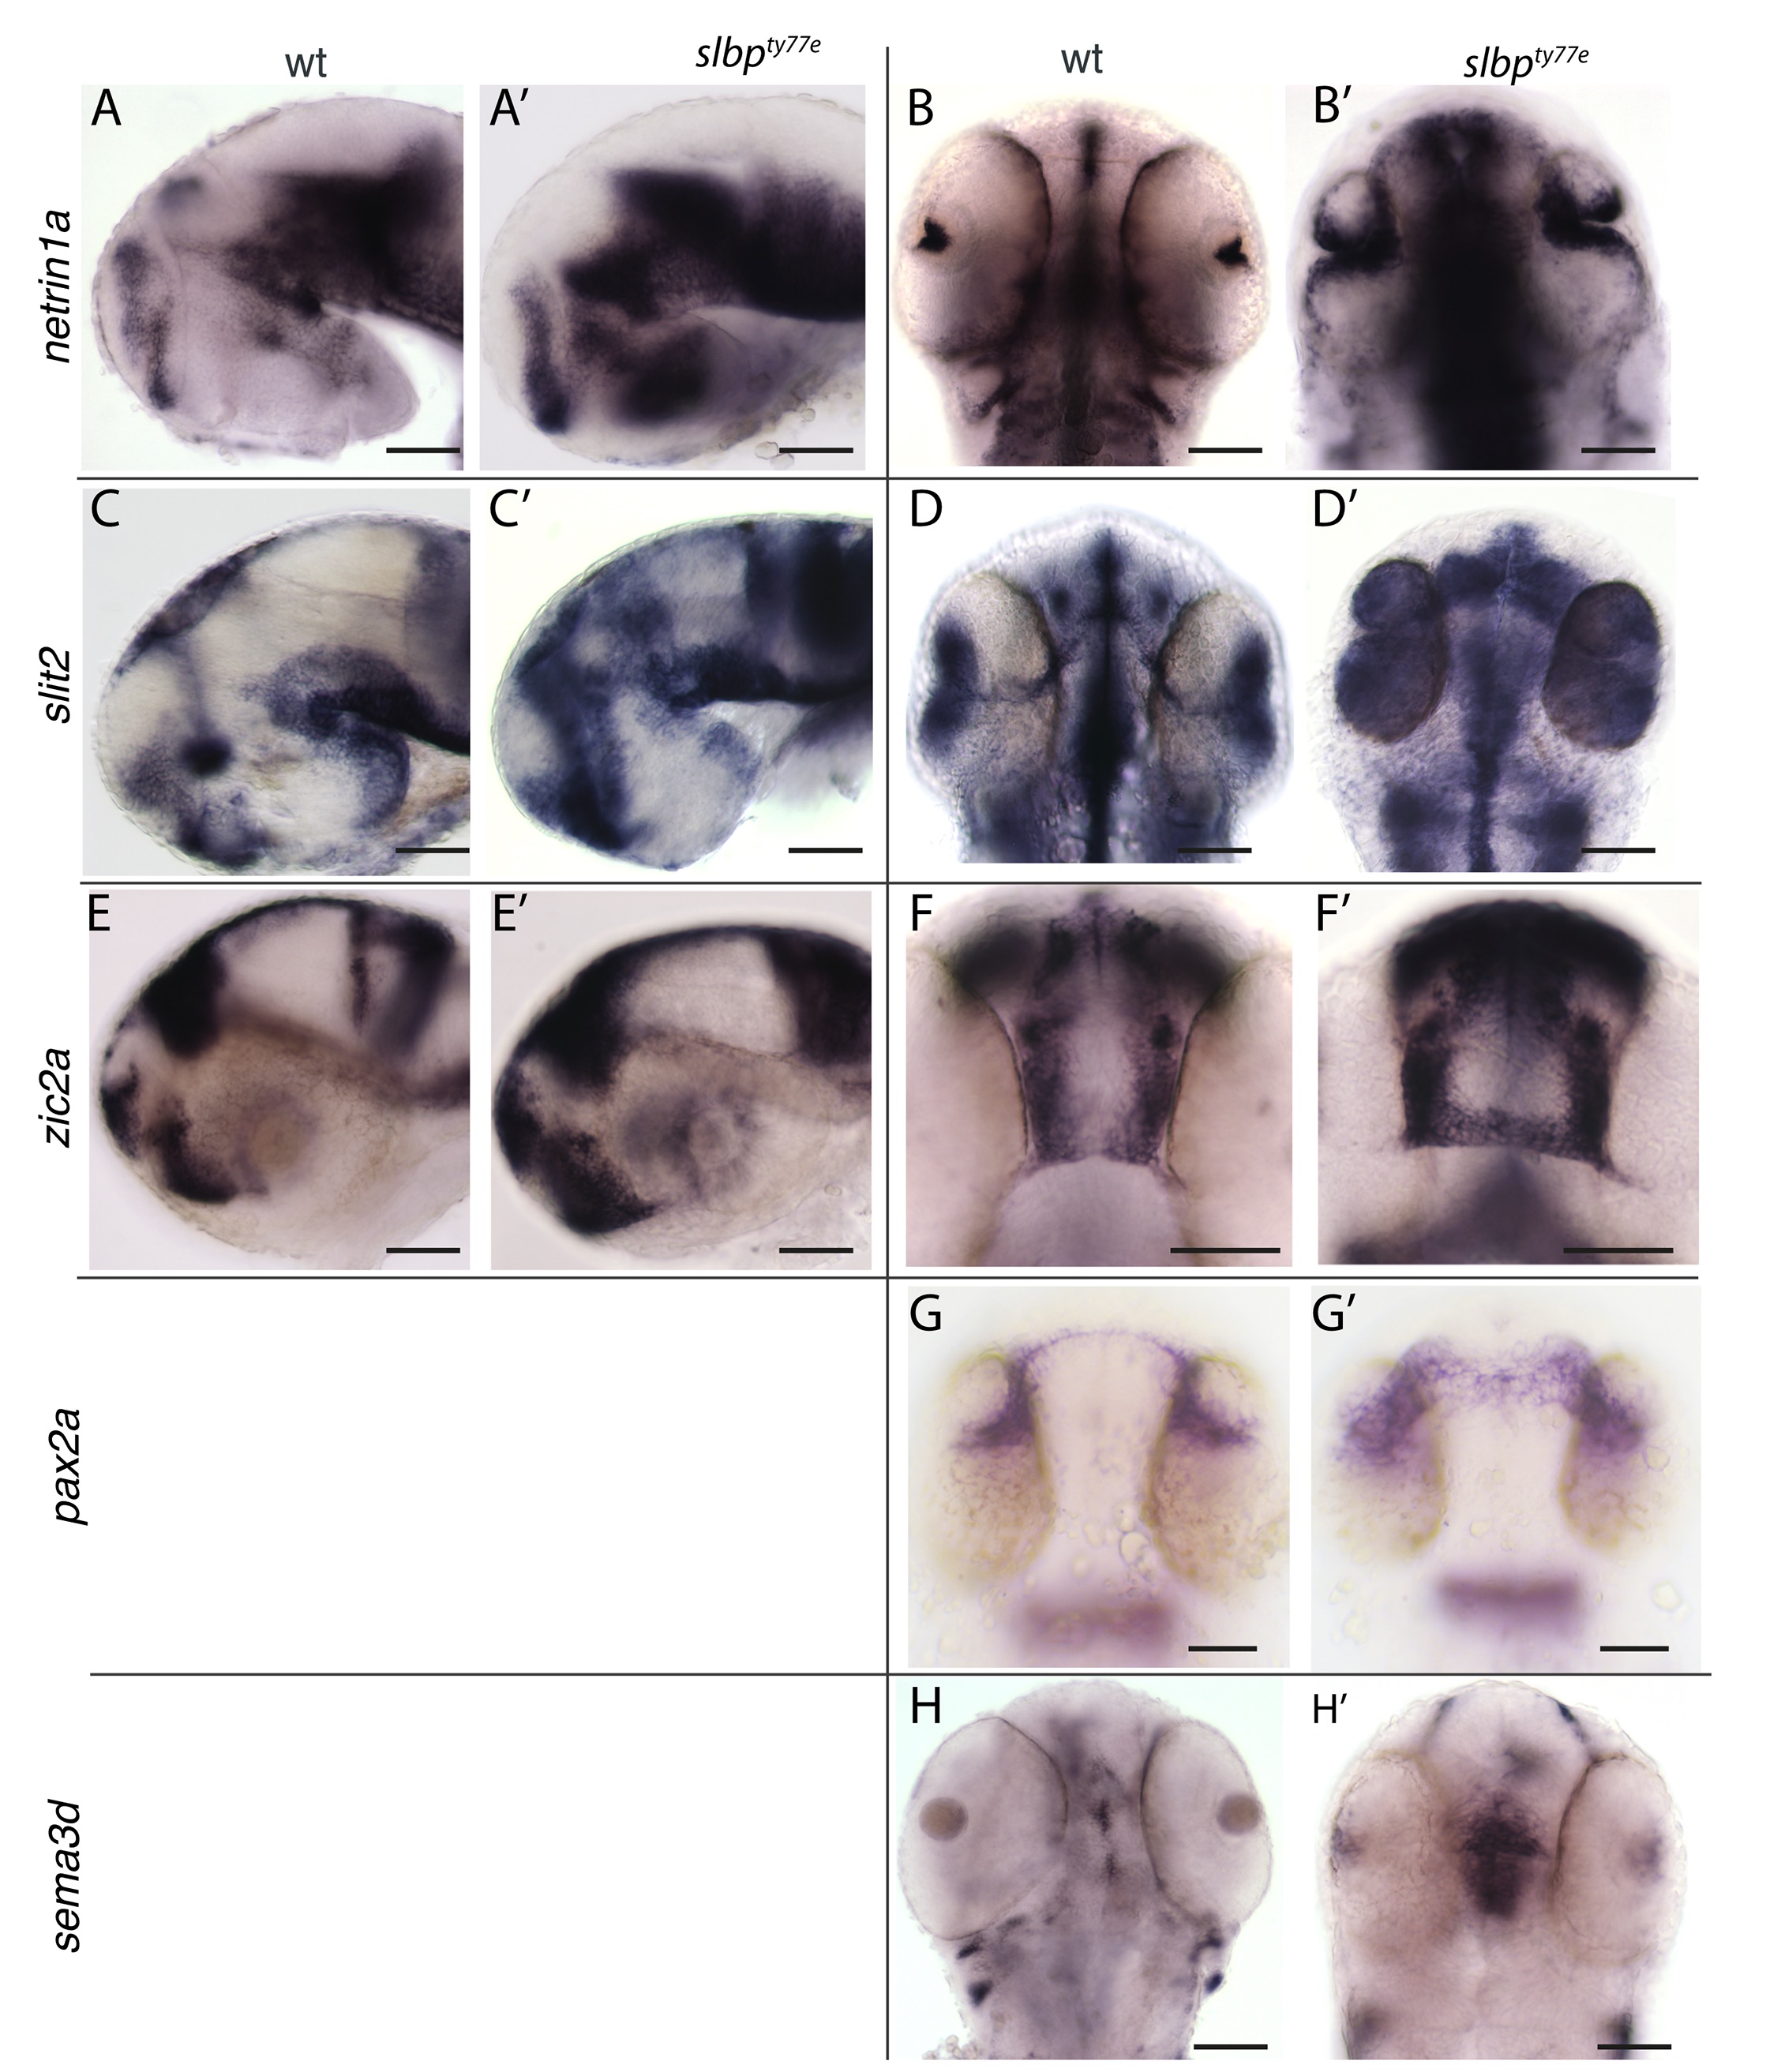
Fig. S2
Views of heads/brains of wildtype (A-H) and slbpty77e (A’-H’) embryos showing expression of genes indicated to the left of each row. Genotype is indicated at top of each column. Lateral views (A,A’,C,C’,E,E’); dorsal views (B,B’,D,D’,F,F’,G,G’,H,H’). All embryos are 60hpf apart from G,G’ which are 30hpf.
Scale bars: 100μm.
(TIF)
Figure Data
Acknowledgments
This image is the copyrighted work of the attributed author or publisher, and
ZFIN has permission only to display this image to its users.
Additional permissions should be obtained from the applicable author or publisher of the image.
Full text @ PLoS One