
IMAGE
Fig. 1
Image
|
Figure Caption
Fig. 1
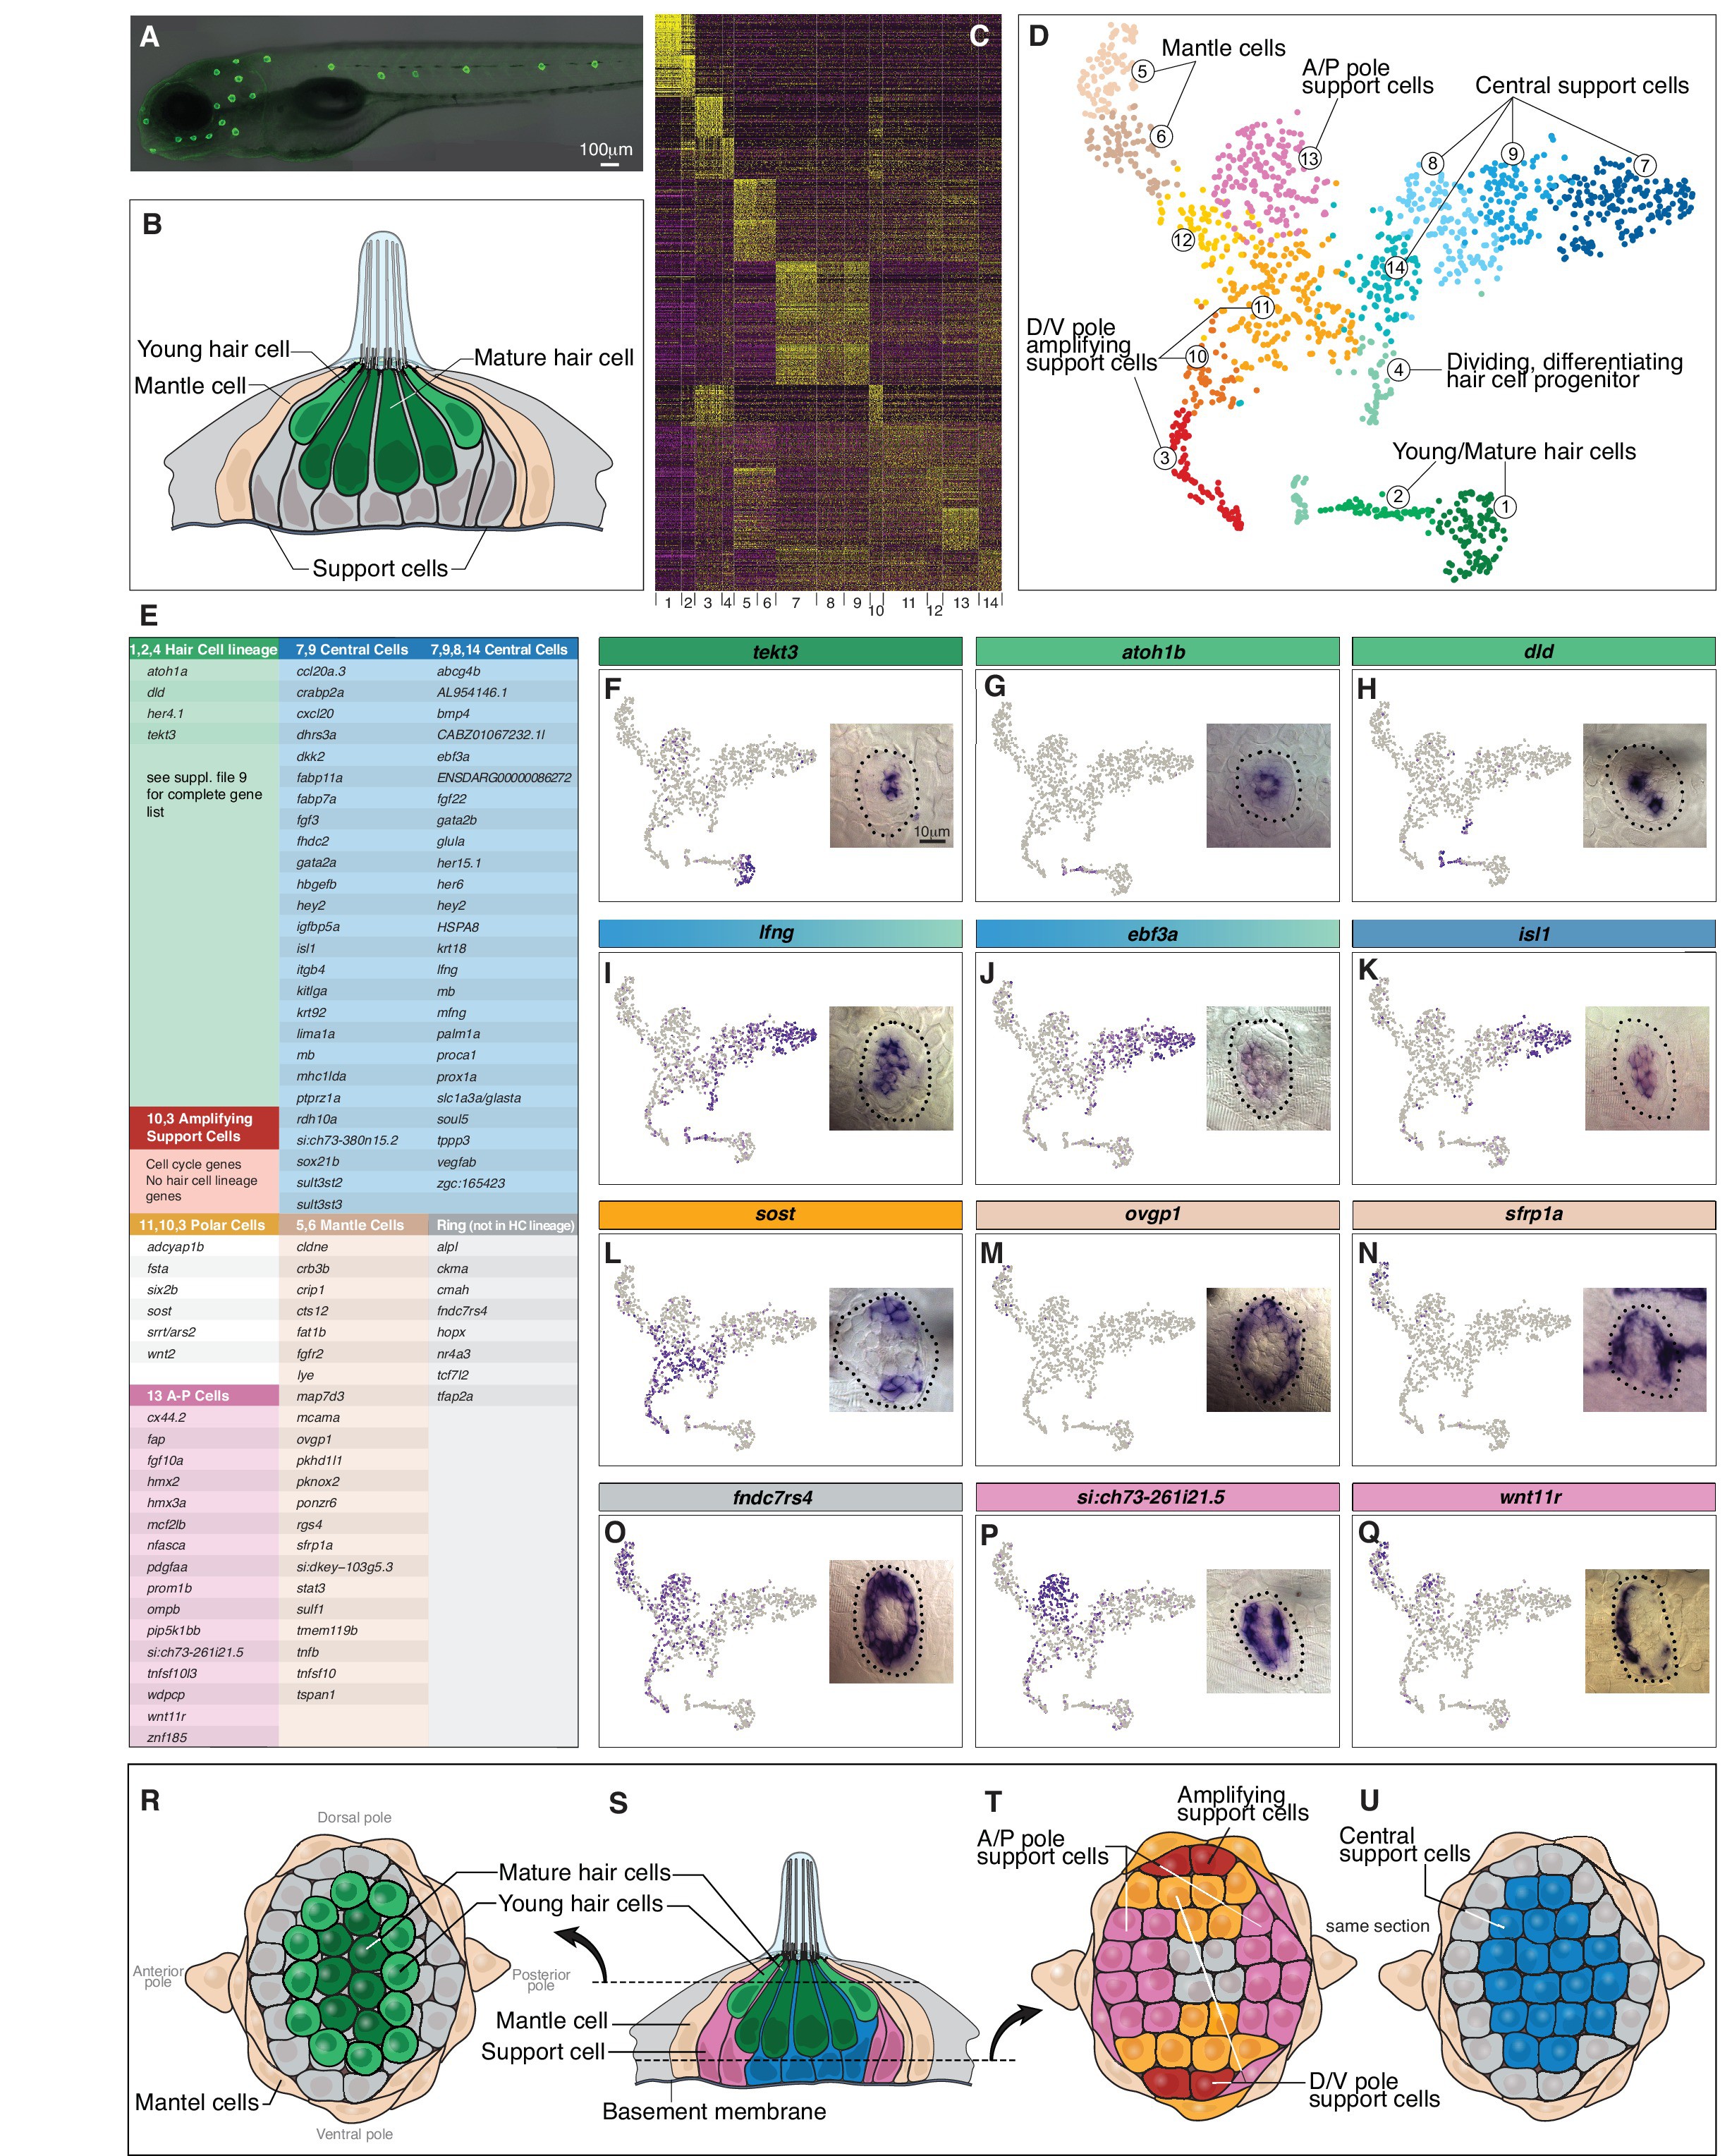
Single cell RNA-Seq reveals support cell heterogeneity.
(A) Et(Gw57a) labels support cells with GFP. (B) Schematic of a cross section through a neuromast. (C) Heatmap showing the expression levels of the top 50 marker genes (y-axis) for each cluster (x-axis), sorted by highest fold change. (D) t-SNE plot showing the different cell clusters. (E) Table of marker genes that distinguish the different cell clusters. (F–Q) t-SNE plots of selected cluster markers and in situ hybridization with these genes. (R, T and U) Schematics of dorsal views of neuromasts with the different cell types colored. (S) Schematic of a cross section through the center of a neuromast.
Figure Data
Acknowledgments
This image is the copyrighted work of the attributed author or publisher, and
ZFIN has permission only to display this image to its users.
Additional permissions should be obtained from the applicable author or publisher of the image.
Full text @ Elife