
|
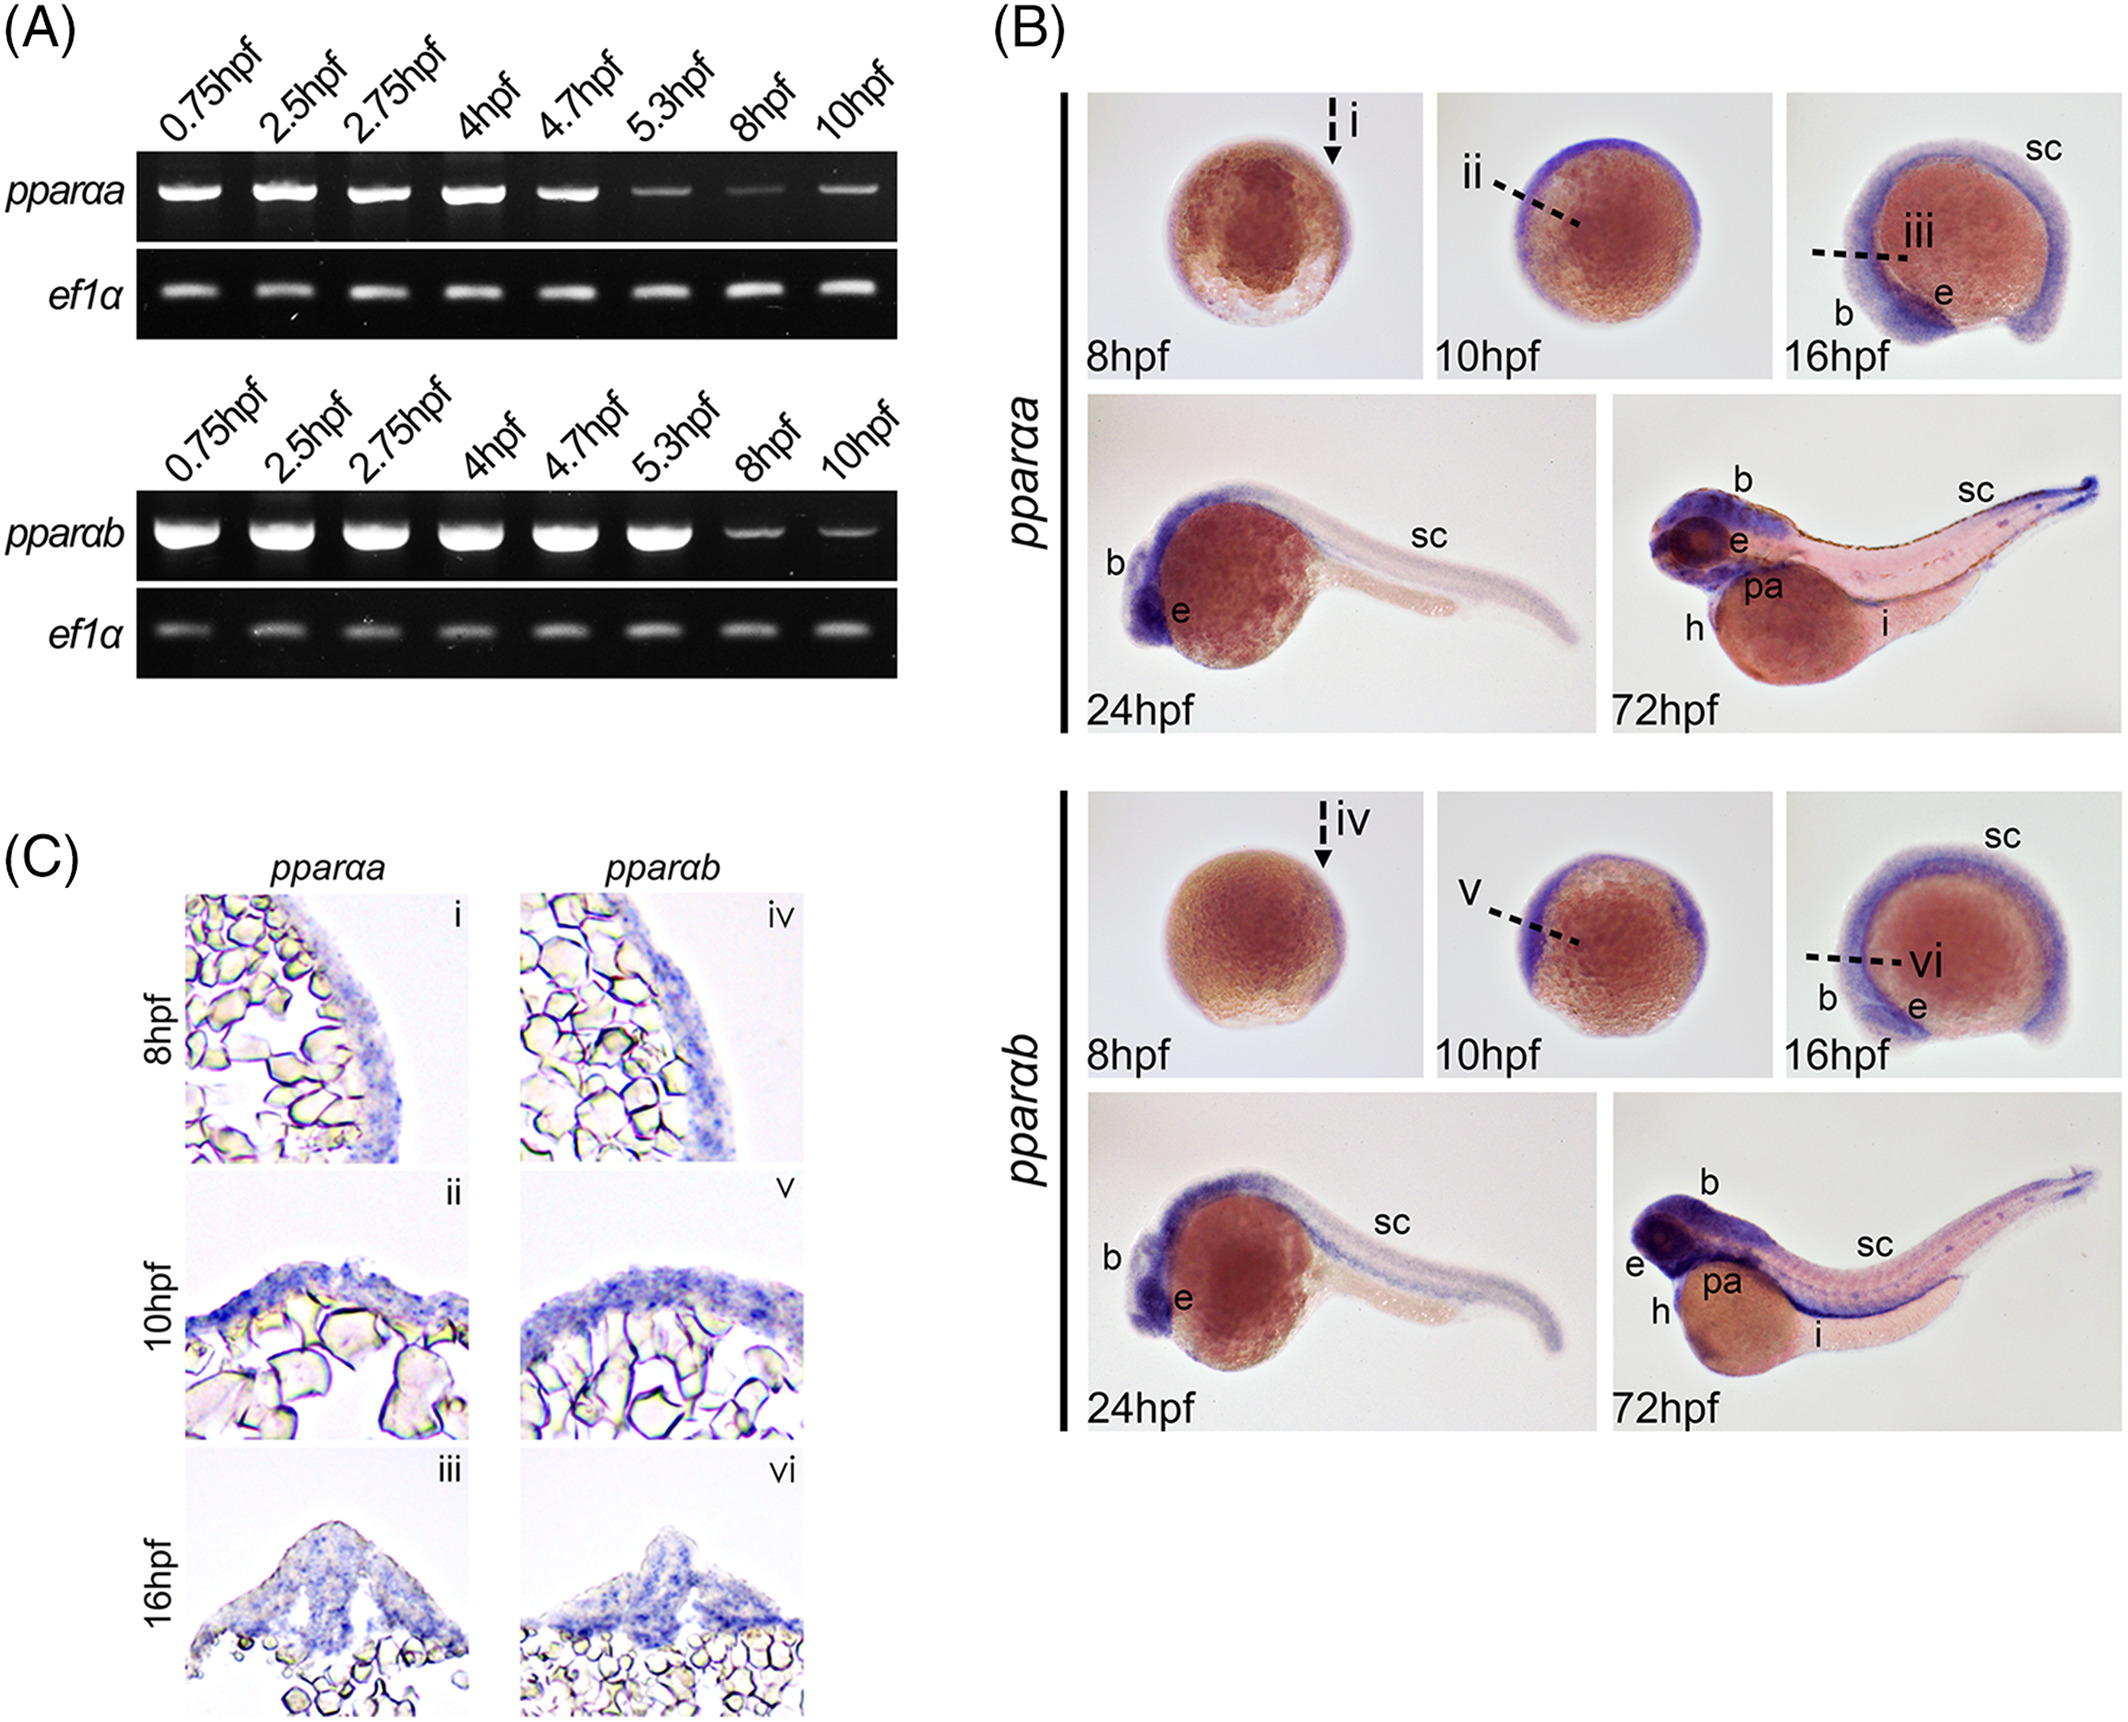
Fig. 1 pparaa and pparab are expressed in the developing nervous system. A: real‐time polymerase chain reaction (RT‐PCR) analysis reveals that zebrafish pparaa and pparab transcripts are detected from 0.75 hpf to 10 hpf. pparaa displays relatively weak expression at 5.3, 8, and 10 hpf, and a high level of expression between 0.75 and 4.7 hpf, whereas pparab expression is detected at low levels at 8 and 10 hpf. Bottom bands show ef1α as a loading control. B: pparαa and pparαb expressions were analyzed using whole‐mount in situ hybridization. Abundant pparαa and pparαb expressions were observed in the embryo at 75% epiboly, bud, and 14‐somite stages. At 24 and 72 hpf, marked expressions were observed in the eyes (e), brain (b), spinal cord (sc), pharyngeal arches (pa), heart (h), and intestine (i). Staging of the embryos is shown in the bottom left corner of each panel. C: Embryos were sectioned sagittally through the neuroectoderm (i and iv) or transversely through the brain (ii, iii, v, and vi) after whole‐mount in situ hybridization. The regions of each section are indicated in (B).