
|
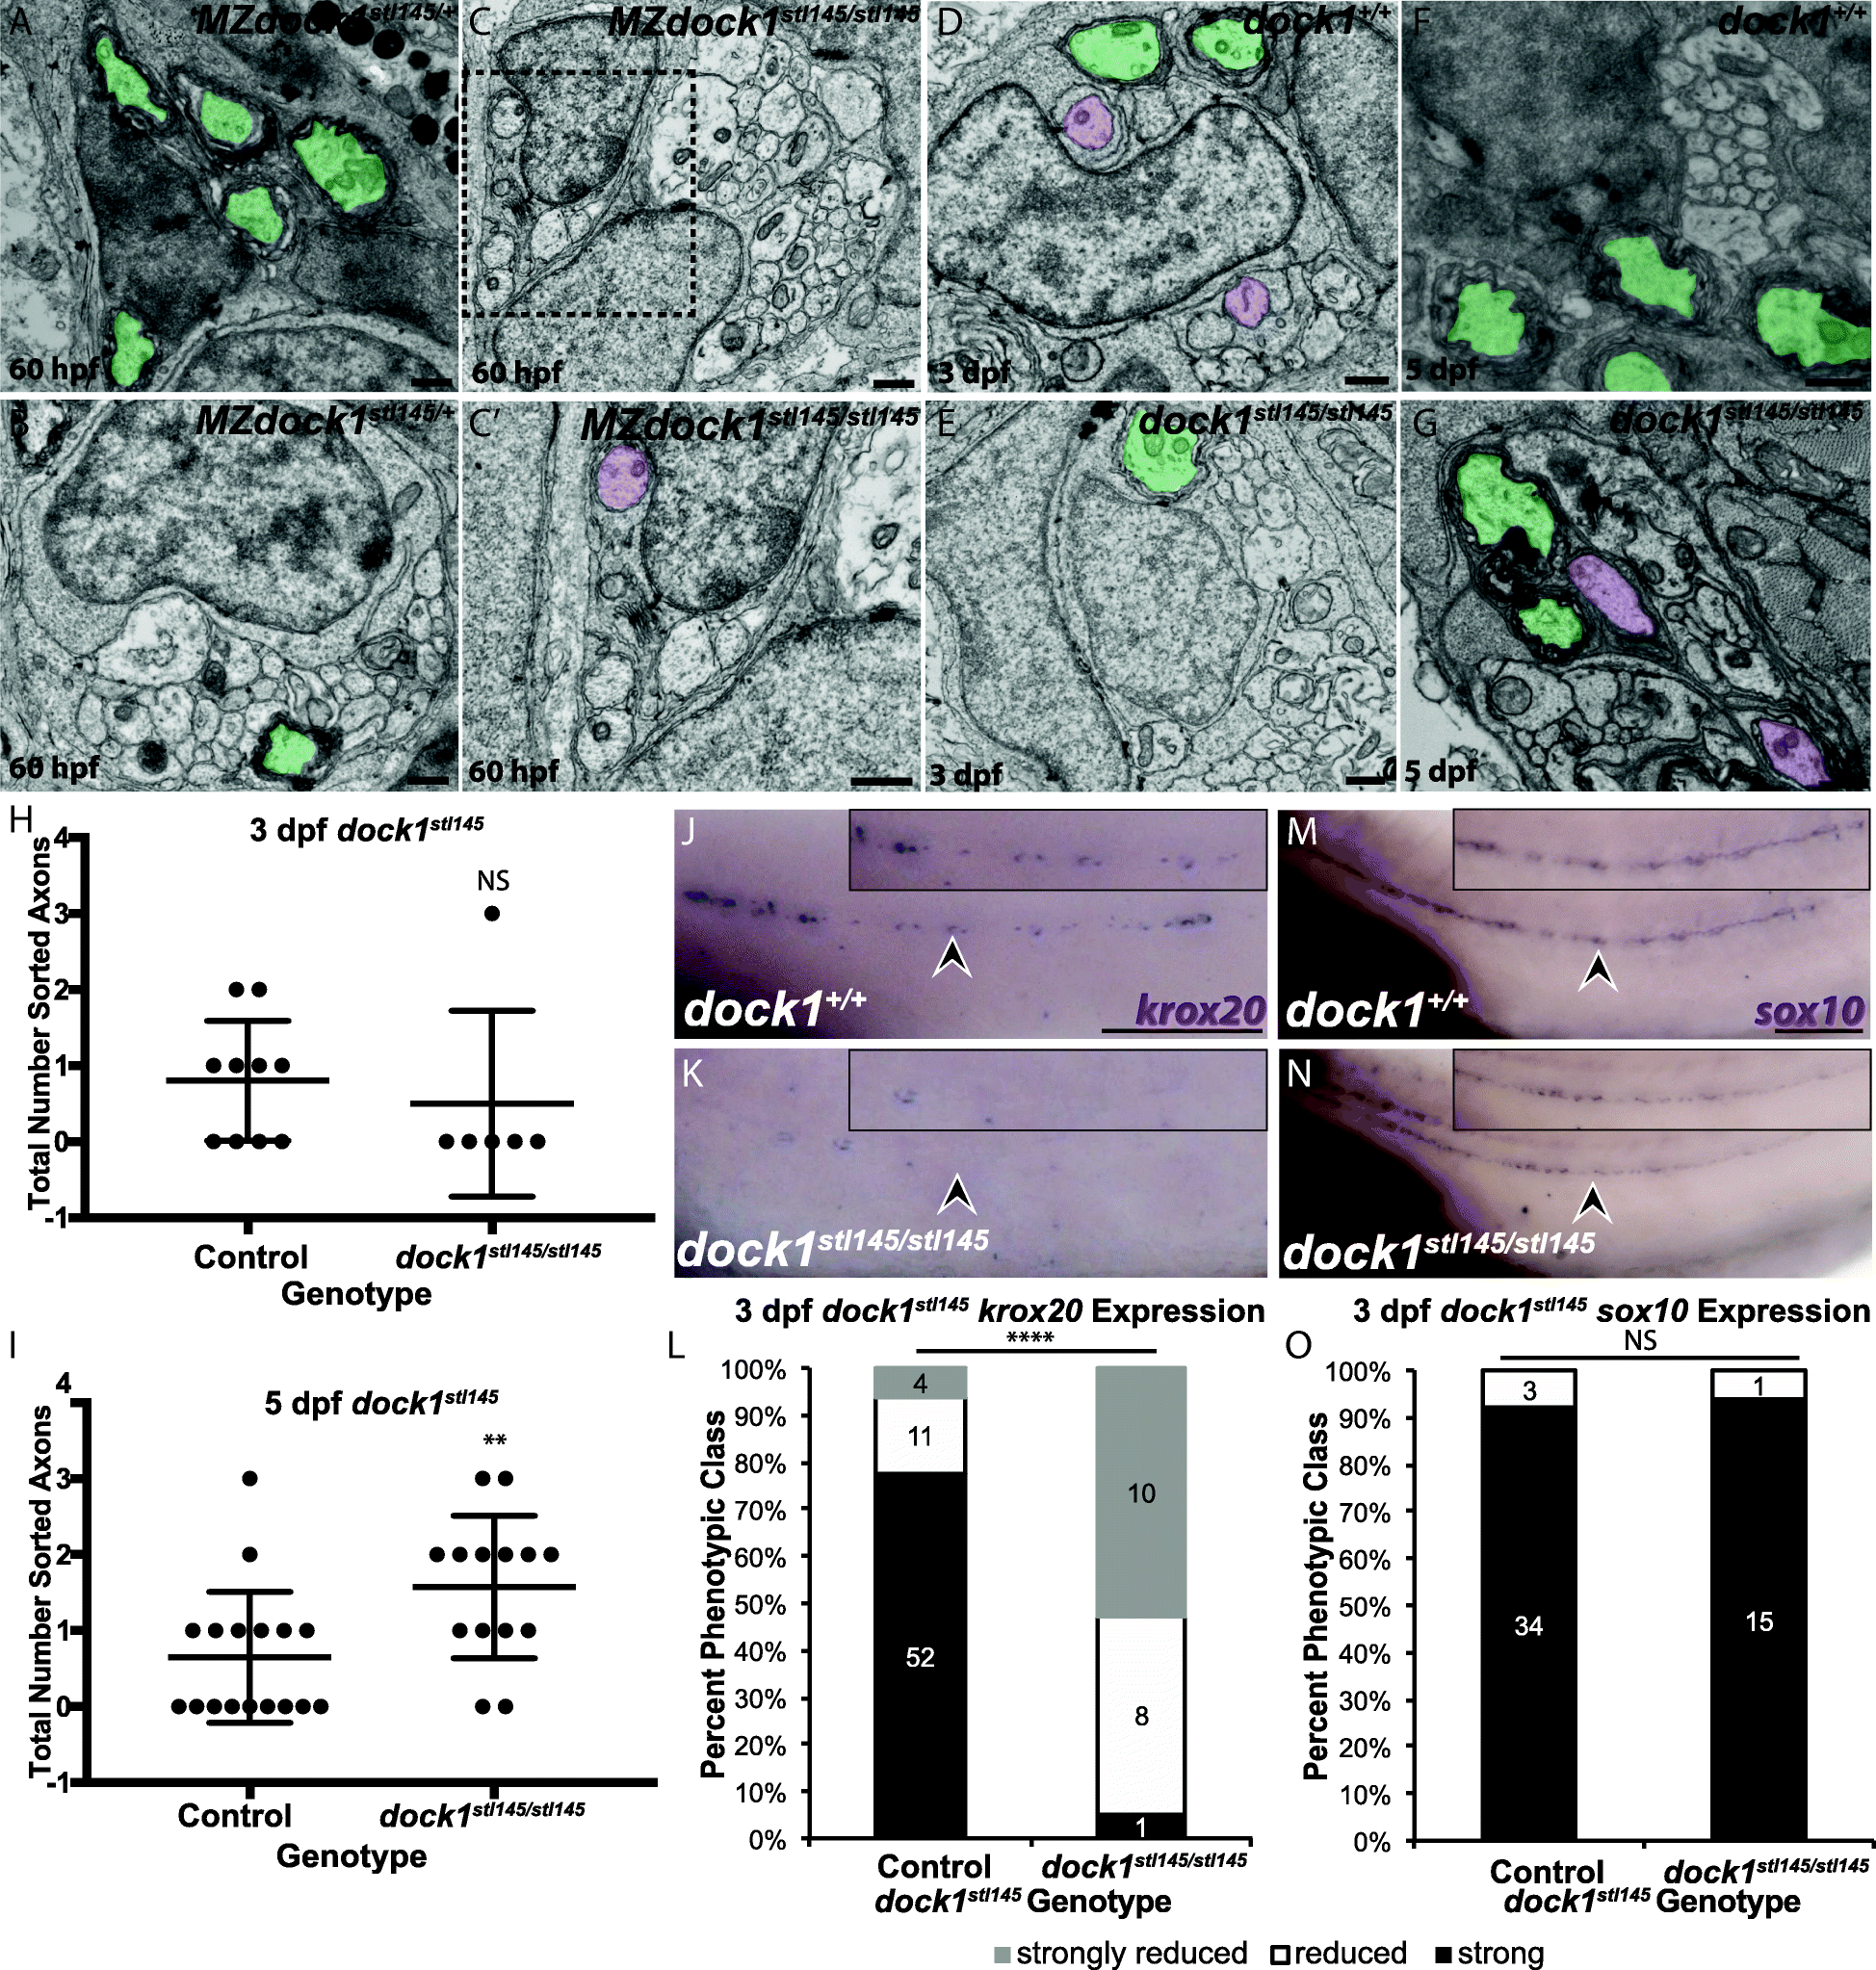
Fig. 5
stl145 mutants exhibit delays in radial sorting and decreased expression of krox20. a-g) TEM of cross-sections of the PLLn. Myelinated axons are pseudocolored in green and axons associated with promyelinating Schwann cells are pseudocolored in purple. Scale bars = 500 nm. a, b) Micrographs from the same PLLn within a MZdock1stl145 heterozygote show Schwann cells myelinating axons at 60 hpf. C) An MZdock1stl145 homozygous larva does not have myelinated axons at 60 hpf, but Schwann cells are extending processes into axon bundles. C′) Magnification of inset from C shows an axon surrounded by a pro-myelinating Schwann cell. d, e) Schwann cells can myelinate and sort axons at 3 dpf in wild-type (n = 6 animals, 10 nerves) and mutant larvae (n = 4 animals, 6 nerves). f, g) More sorted axons are present in mutants (n = 8 animals, 15 nerves) at 5 dpf compared to controls (n = 11 animals, 17 nerves). Quantification of the number of sorted axons at h) 3 dpf and i) 5 dpf shows a statistical difference at 5 dpf (unpaired t Test with Welch’s correction). j, k) Lateral view of WISH for krox20 at 3 dpf. Arrowheads indicate PLLn. Inset panels show a magnified view of the PLLn. Scale bar = 50 μm. j) krox20 is expressed along the PLLn of control larvae (n = 67) whereas k) dock1stl145 homozygous mutants express little to no krox20 along the PLLn (n = 18/19). l) Quantification of WISH for krox20 at 3 dpf based on phenotypic classes and genotypes for the stl145 lesion (p < 0.0001, Chi-squared analysis). m, n) Lateral view of WISH for sox10 at 3 dpf. Arrowheads indicate the PLLn. Inset panels show a magnified view of the PLLn. Scale bar = 50 μm. m) Control larvae exhibit sox10 positive Schwann cells along the PLLn (n = 37) similar to N) dock1stl145 homozygous mutants (n = 16). o) Quantification of WISH for sox10 at 3 dpf based on phenotypic classes and genotypes for the stl145 lesion (p = 0.8141, Chi-squared analysis). Bars represent means ± SD, **p < 0.001, **** p < 0.0001