
Fig. 2
- ID
- ZDB-IMAGE-180516-4
- Genes
- Publication
- Zhang et al., 2017 - Retinoblastoma 1 protects T cell maturation from premature apoptosis by inhibiting E2F1
- All Figures
- Figures for Zhang et al., 2017
|
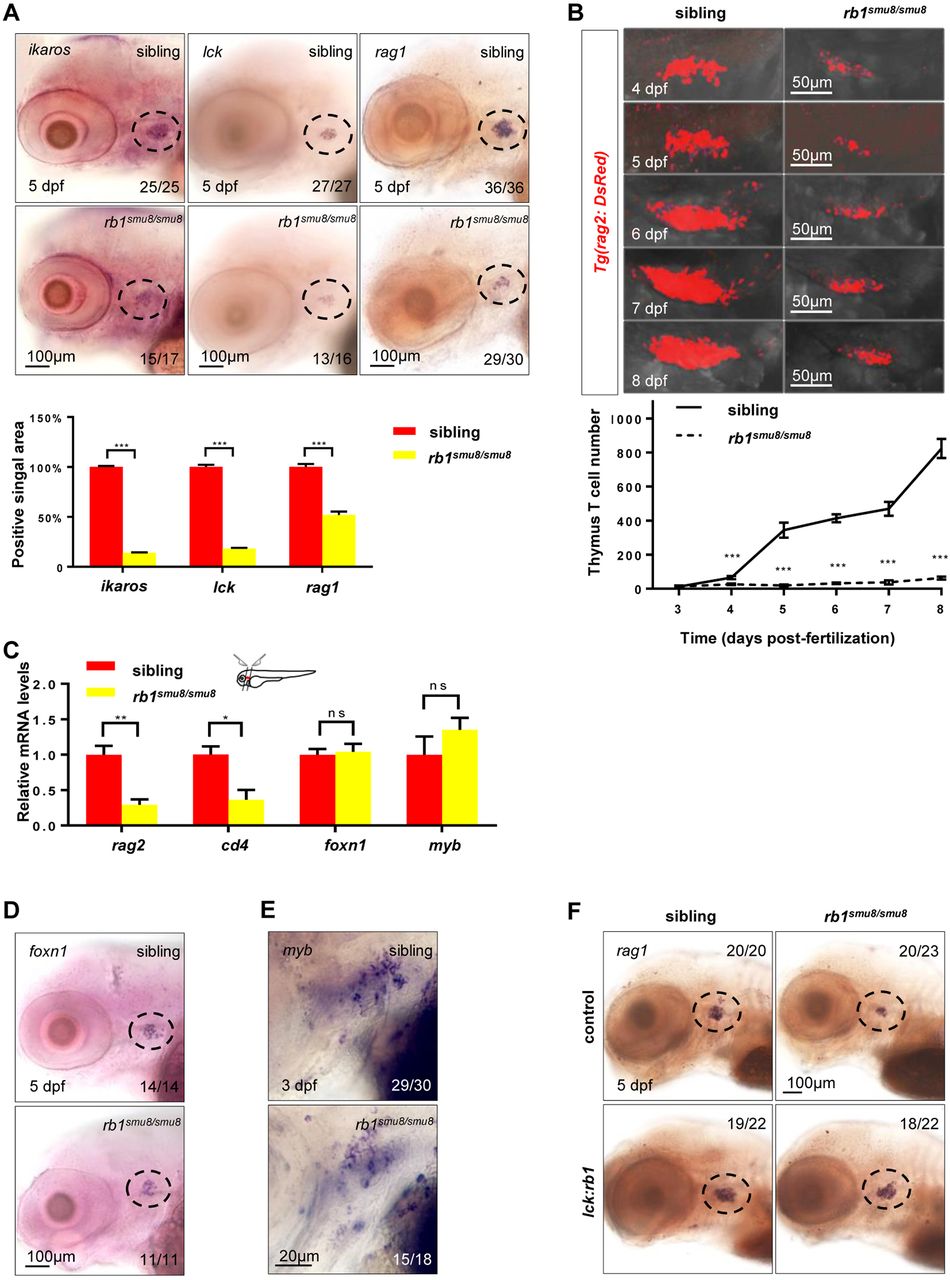
Fig. 2
T-cell maturation is impaired in rb1-deficient embryos. (A) Expression of ikaros, lck and rag1 in the thymus (broken line) of siblings and rb1 mutants at 5 dpf (upper panels). Embryos for whole-mount in situ hybridization were obtained from an incross of genotyped heterozygous rb1 mutants. Scale bars: 100 μm. The positive signal areas were analysed using Image-Pro Plus (lower panel) (***P<0.001; mean±s.e.m.; n=16). (B) Confocal images of rag2:DsRed cells in the thymus of the siblings and rb1smu8/smu8 mutants from 4 dpf to 8 dpf (upper panels). Scale bars: 50 μm. Quantification of T-cell number in sibling embryos and rb1smu8/smu8 mutants (lower panel) (***P<0.001; mean±s.e.m.; n=10). (C) Schematic of the lateral view of a zebrafish indicating the region of the thymus excised for RNA extraction (red dot). qPCR analysis of rag2, cd4, foxn1 and myb in the thymus of siblings and rb1-deficient embryos at 5 dpf (mean±s.e.m.; **P<0.01, *P<0.05, ns, not significant; n=30). (D) Whole-mount in situ hybridization of foxn1 in the thymus (broken line) of siblings and rb1smu8/smu8 mutants at 5 dpf. Scale bars: 100 μm. (E) Whole-mount in situ hybridization of cmyb in the thymus of the siblings and rb1smu8/smu8 mutants at 3 dpf. Scale bars: 20 μm. (F) Whole-mount in situ hybridization of rag1 in the thymus (broken line) at 5 dpf after injecting with control and pTol-lck:rb1 plasmid. Scale bars: 100 μm.