
Fig. 2
|
Fig. 2
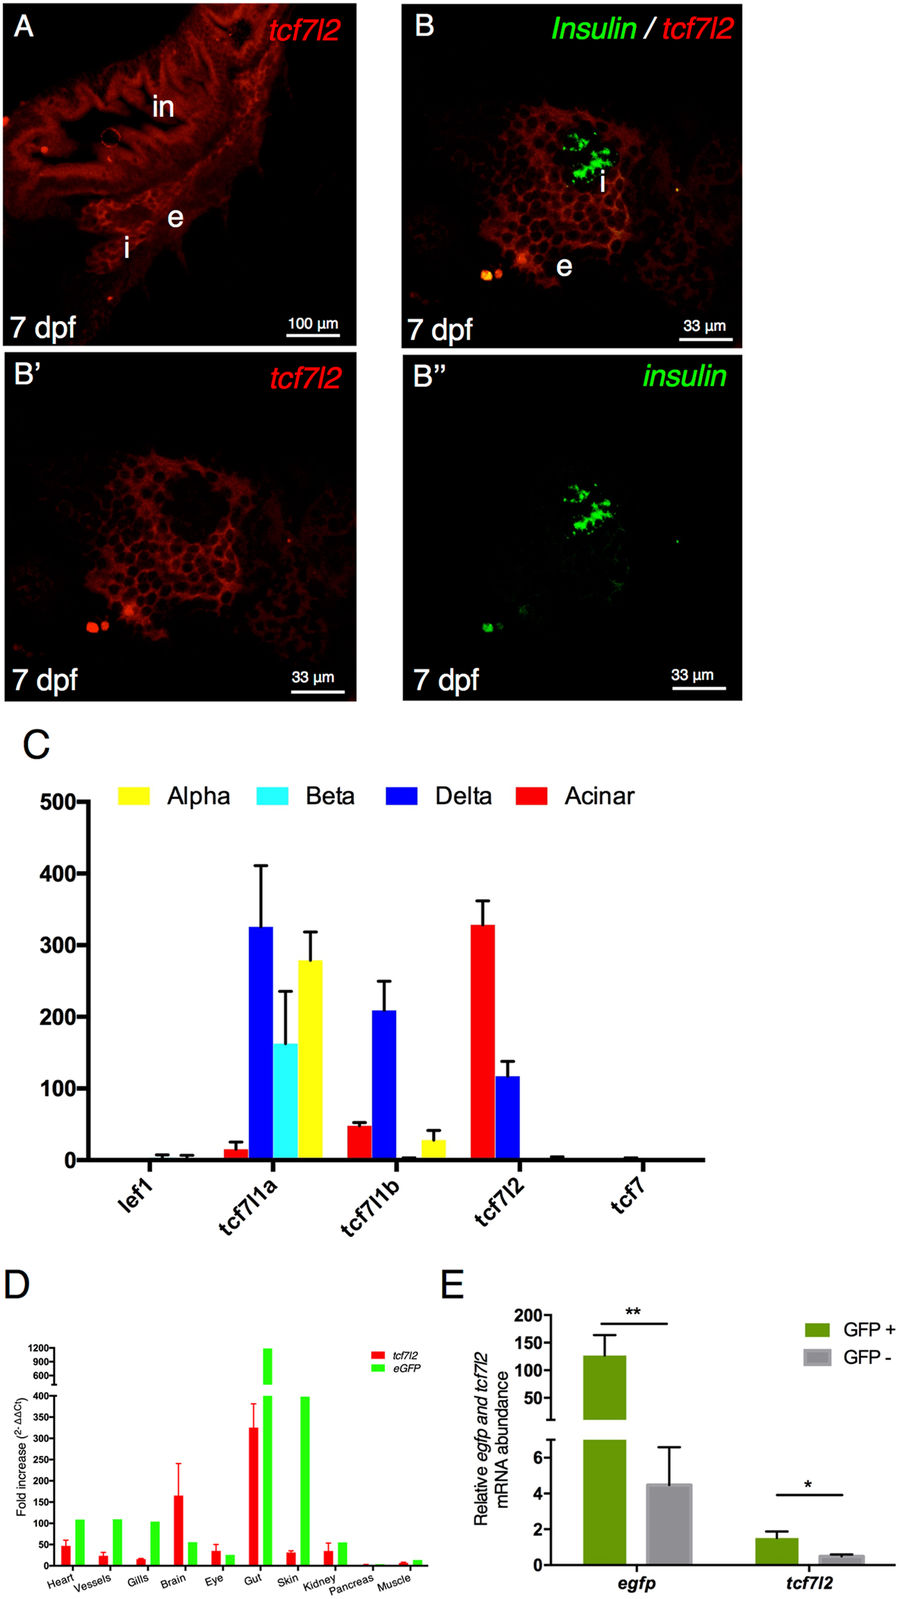
Canonical Wnt signalling and tcf7l2 expression in the pancreas. (A,B) Single and double fluorescent WISH comparing the expression of tcf7l2 and insulin at 7 dpf. Images show confocal single planes at 7 dpf at different magnification of (A) (20x) and (B,B’,B”) (60x). Merging the green and red channels identifies regions with distinct gene expression of the two genes (B’,B”). in: intestine, e: exocrine tissues, i: principal islet. Scale bar = 100 μm. (C) Expression level (count normalized by library size) obtained by RNAseq of different Tcf/Lef genes in α, β, δ and acinar cells from adult zebrafish. (D) tcf7l2 and egfp expression values from 10 different tissues derived from transgenic Tg(fli1a:EGFP)y1 adult fish. Brain (Br), Eye (Ey), Gills (Gi), Gut (Gu), Heart (He), Kidney (Ki), Muscle (Mu), Pancreas (Pa), Vessels (Ve). (E) Enrichment of GFP+ cells from Tg(fli1a:EGFP)y1 zebrafish embryos. Relative expression of indicated genes, in GFP+ (green bars) and GFP− (grey bars) cells, determined by quantitative RT-PCR. Relative expression levels were determined by normalization to arp. Values represent the mean ± SEM. Asterisk above column indicate statistical differences among groups.